
[FREE] Crude Crash Context
Look out below; take refuge in the data

This Complimentary Context is a free quick-take publication based on the comprehensive datasets found in my monthly Global Oil Data Deck. For more thorough and regular Context, please consider becoming a paid subscriber.
If you value this free research, hit the LIKE button.

Crude oil prices fell nearly $10 yesterday to below $100 per barrel (WTI), now down more than $20 from their early-June high.
But the selloff is flashing all the telltale signs of a speculative washout as flat prices collapsed without any commensurate deterioration in calendar spreads (i.e., the shape of the futures curve)
Crack spreads have also fallen but it remains too early to tell why; perhaps they are easing for similar washout reasons, we’ve finally turned the corner on the refining bottleneck, or we’re truly beginning to see the weight of economic slowdown on refined product values.
To my eye the crude selloff appears overdone; but, given the heightened volatility regime and prevailing dour macroeconomic sentiment regime, it is quite possible that prices fall further still—even if I think further declines are unlikely (and even more unlikely to be sustained).
Crude got taken out to the woodshed yesterday after what has already been a pretty terrible month—WTI fell below $100 per barrel for the first time since May, down more than $20 per barrel from early June.
What triggered this steep selloff? Perhaps it was renewed lockdown fears in China or an overreaction to a call from Citibank that prices were headed toward $65/bbl on recessionary pressure. Who knows—and quite frankly, it really doesn’t matter. Ultimately, something started the selling and, from the looks of the ferocity of the resulting selloff, it triggered speculative participants (or their algorithms) to abandon their positions en masse.
More importantly, what does this selloff mean? Could it be the start of a bear market for crude, a confirmation of recession fears, or simply the latest episode of wild volatility that keeps market participants (including yours truly) on their toes?
First and up front, this post is not a forecast. Rather, I want to share some of the key indicators that I use to assess the [relative] health of the oil market. I am broadly bullish on crude prices over the coming year, as I have said before, on the combination of lackluster supply growth, resilient demand (I don’t have a “hard landing” in my outlook), and historically low inventories. But this selloff has caught even me off guard—and there’s nothing saying that prices can’t go lower, still.
It’s just my view that lower prices are unlikely (and even more unlikely to be sustained).
Speculative Positioning: How Short Can We Go?
The first indicator I like to look at is the relative positioning of so-called speculative participants in crude contracts. When the price of crude drops by $10 per barrel over the course of the day absent any material industry news flow—like, say, yesterday—you can usually count on the pullback being caused by a speculative positioning washout of some sort.
As I’ve expounded before, there are two ways to think of speculative participants (i.e., hedge funds, etc.). When I first entered the industry, I was told: hedge funds and other “managed money” participants should be viewed as the “smart money” and you should generally follow their lead. On face value, this made sense—plus who was I, a newly minted bank economist, to disagree with the fancy hedge funds?
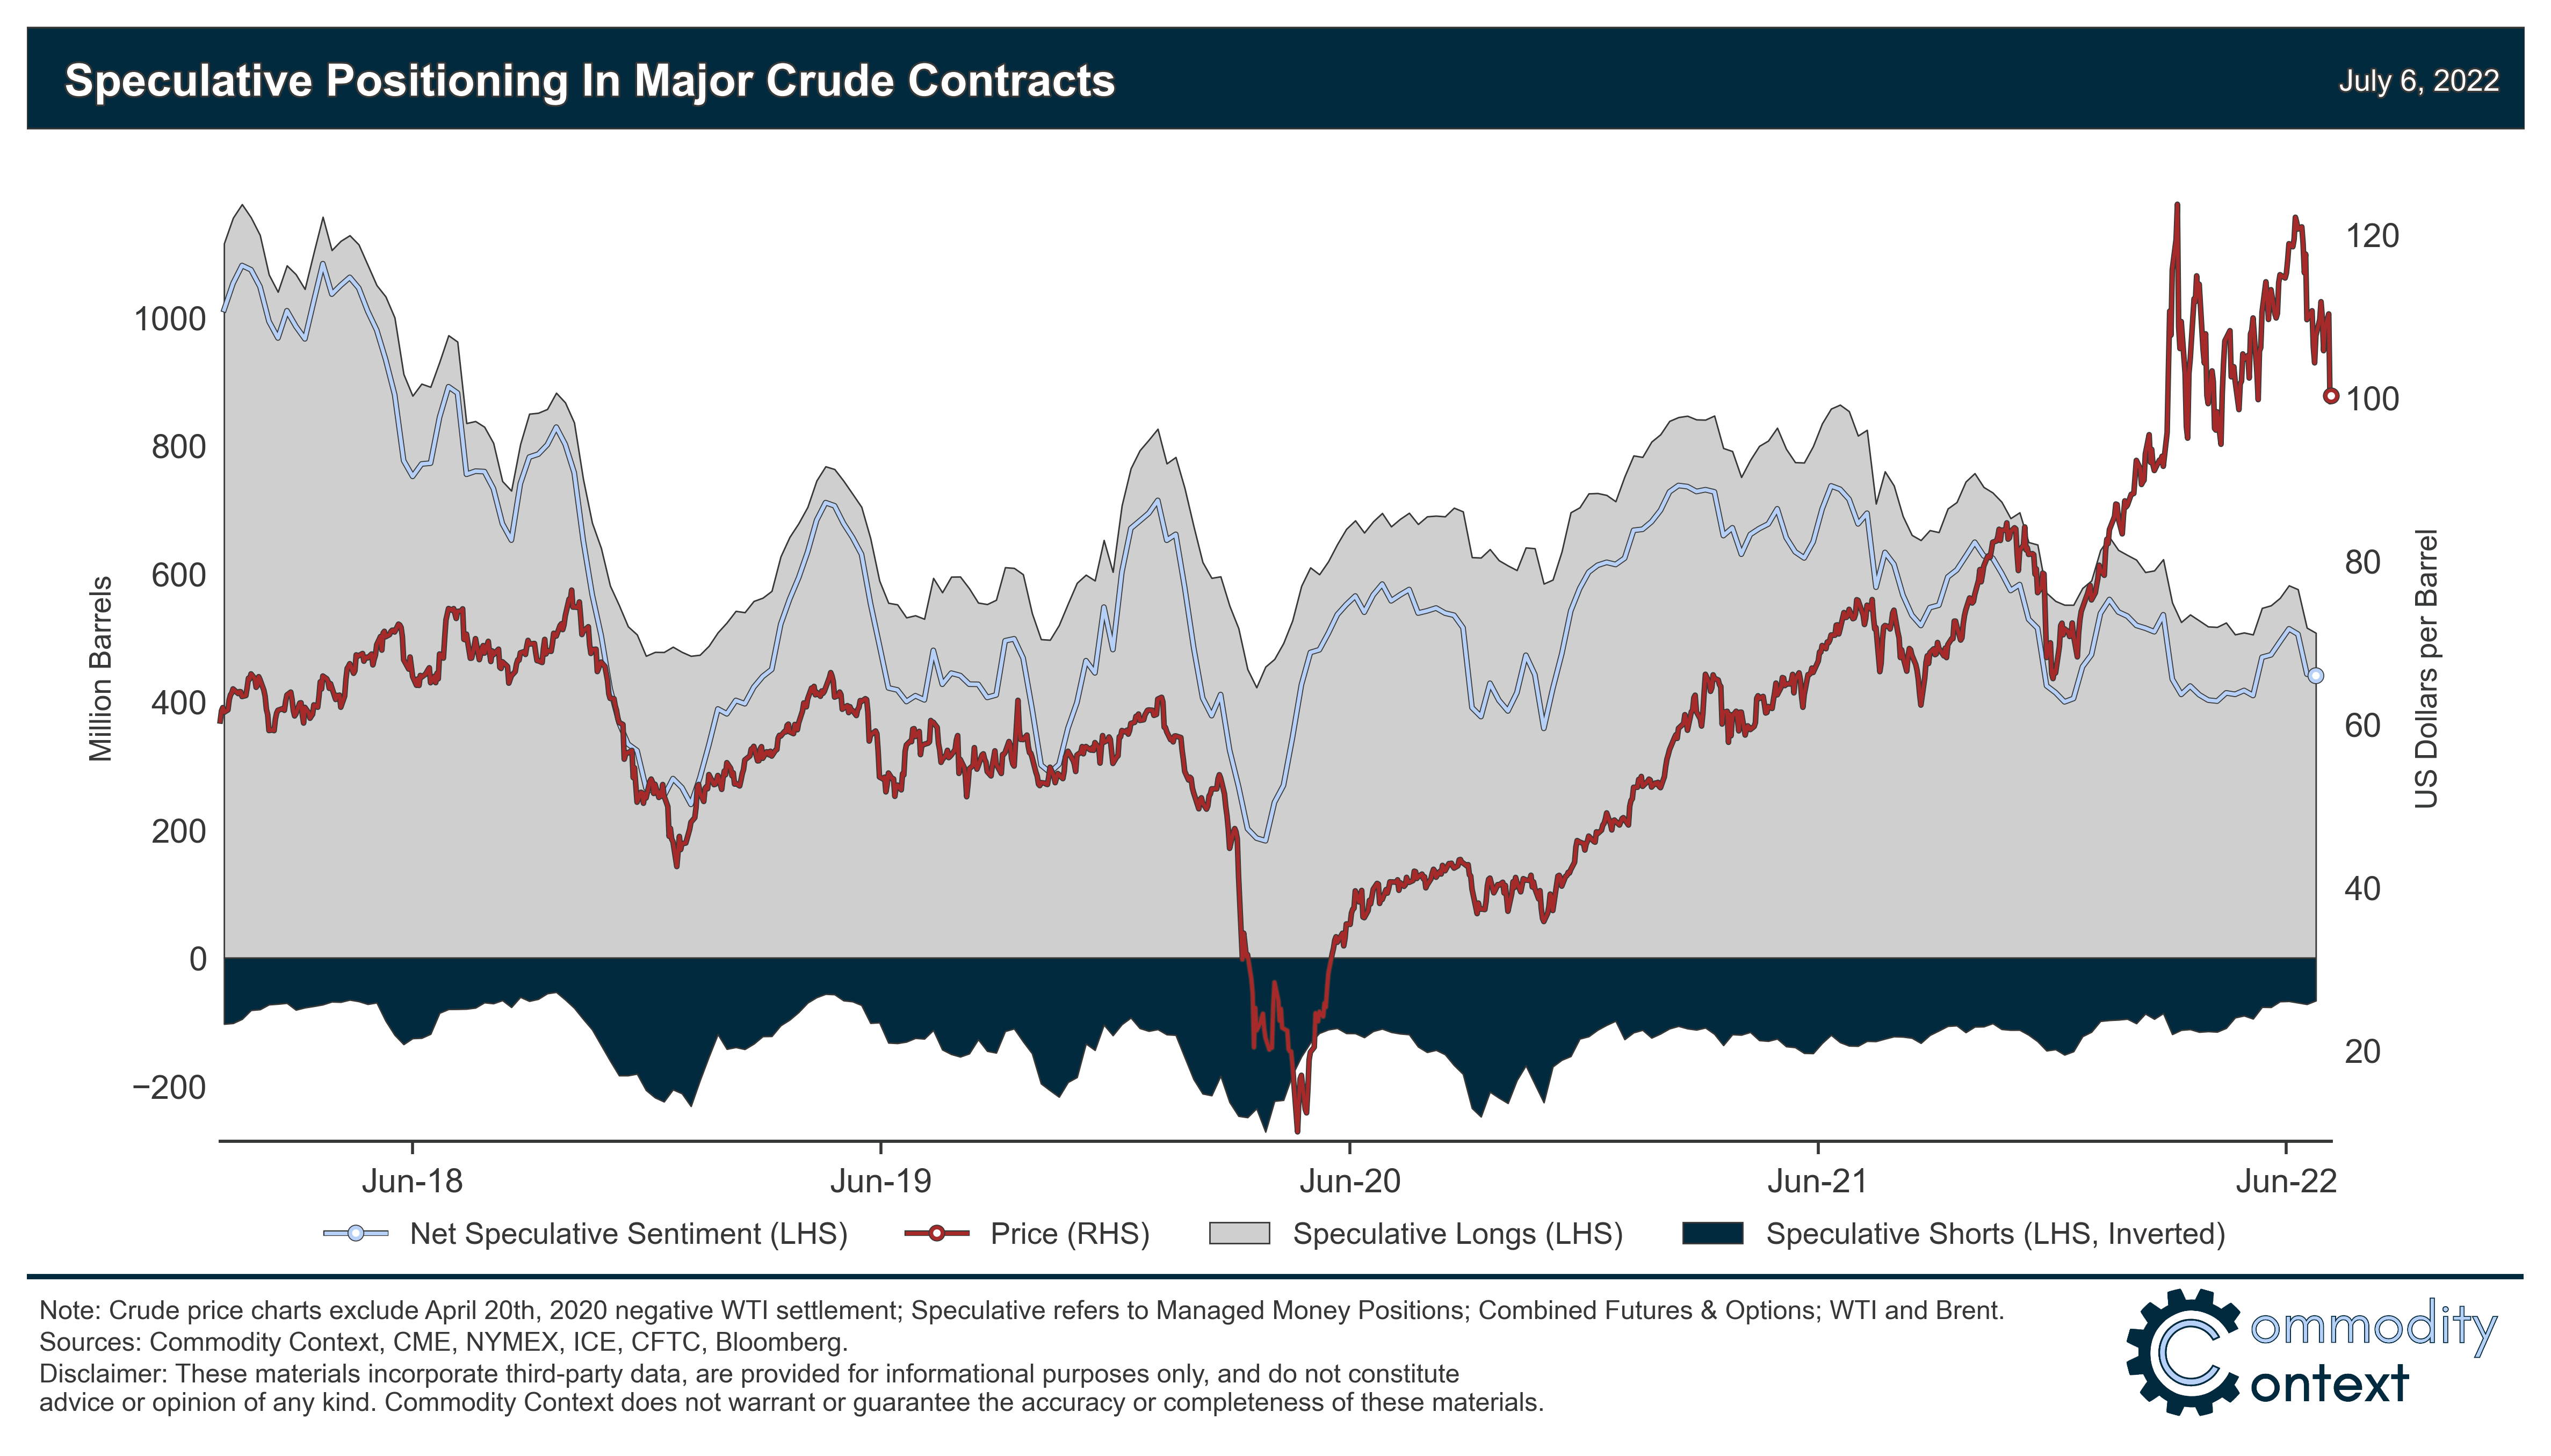
But these days, I think of speculative participants more as a contra-indicator: they are simply the marginal and most volatile buyers of futures contracts. When they get too far ahead of themselves over a given stretch of time, they have a tendency towards returning to the mean rather than continuing to chase the asset higher (or lower). This is true when speculative positioning is abnormally net-long (a bearish signal if/when those positions mean-revert) or short (bullish).
What’s notable about this particular sell-off is that those speculative positions weren’t especially long going in (chart above), although it seems reasonably apparent that their liquidation was a big part of the pace of declines (confirmed in next Thursday’s Commitment of Traders Report). That’s the trouble with positioning data: the positions can always go lower, though each decline makes subsequent pullbacks less likely all else equal.
Generally, speculative participation in crude price action following Russia’s invasion of Ukraine has been lackluster, in large part because current wild volatility makes it extremely expensive for firms to express their view through crude futures. Low participation also means that volatility has come predominantly from non-speculative activity in the market, which is a refreshing counter-narrative to those who claim moneymen are always the driver of crude volatility.
Calendar Spreads: Backwardation Unchanged

While there’s a lot of focus right now on the flat price of crude (i.e., the simple front-month contract), I find even more information in the shape of the curve itself. And on that front, the market remains hellishly tight. Moreover, something unusual is going on if crude prices crater and there’s no real change in calendar spreads, like we saw yesterday (chart above).
Calendar spreads (i.e., the difference between the front-month and another further-dated contract) were basically unmoved through this latest selloff on a 1, 3, and 12-month basis. Calendar spreads, or “term structure”, are the primary signal by which inventories build or drain.
When there is a large prompt-price discount relative to later-dated cargoes (a structure known as “contango”), the market is signaling an oversupply in spot markets and incentivizing market participants to stash their barrels in storage. In this scenario, those who own or can access inventory space are able to buy a prompt barrel and immediately sell it 6 or 12 months ahead for a guaranteed profit (the spread less any storage and financing costs).

Conversely, we are currently sitting in a tight spot market. The prompt contract is trading at a premium (a structure known as “backwardation”) and any inventory-holding incentive has long been eliminated. In fact, inventory holders are actually penalized on an opportunity cost basis for withholding stored barrels from the market. Backwardation tells inventory holders to drain their tanks; the wildly exaggerated backwardation we see today tells them to do it in a hurry—and that’s exactly what we’ve seen them do over the past year and a half as inventories fell well below what we’d consider healthy levels (chart above).
Meanwhile, this market reaction means something entirely different for equity valuations. While my view of the parallel downward shift of the curve is reasonably sanguine given the preservation of extreme backwardation, yesterday’s selloff means a very direct hit to multi-year revenue projections given that many equity research models simply insert the prevailing curve—this wouldn’t be nearly so bad if just the front of the curve cratered, even if that would be a much bigger worry sign for me. This logic helps explain why the selloff was so especially furious for many E&P equities, which has the second-order effect of being especially depressing as an investment signal.
On the equities side, the only obvious way to loosen the investment handcuffs in the current environment of investor-imposed producer cashflow discipline would be higher equity valuations, which is exactly where we were heading until a few weeks ago. Here though, monetary policy authorities’ efforts to tame inflationary pressure could turn around to bite them, as diminished supply-side investment interest blunts the demand corrective effects of tighter monetary policy.
Crack Spreads: Rolling Over?

Another interesting development over the course of crude’s no-good-very-bad month is that crack spreads have come back down notably (chart above), with that trend continuing even when crude was collapsing yesterday. As with many of these indicators, the move could mean a variety of things—some comforting for crude prices, some a serious cause for concern.
On the “comforting” side, lower crack spreads could be a sign that we’re turning a corner on the refinery capacity bottleneck that I discussed last week. This would be great from the perspective of demand destruction worries because it’s the price at the pump, not the price at the refinery gate, that will drive consumer behavior. For the same reason, an easing of the refinery crunch is fantastic for the Federal Reserve, which has taken a keen interest given the primacy of pump prices in consumer inflation expectations (as I discussed recently on Bloomberg’s Odd Lots podcast).
The pessimistic interpretation is a doozy: you typically want to see strong crack spreads (though admittedly not this strong) as a signal that the value of, and thus demand for, refined products is holding up. So if, for example, you were looking for recession risks, you’d expect to first see potentially weaker economic activity and consumer demand in product prices, which would eventually trickle back to refinery demand for crude.
Conclusion
Crude remains trapped in a volatility regime sparked by Russia’s invasion of Ukraine, which makes market movements veer to the extreme at a moment’s notice. Thankfully the value of a barrel of crude, my key indicators suggest that the health of the oil market remains relatively intact despite the flat price carnage. For me, yesterday’s price collapse had all the telltale signs of a positioning flush and much of the rest of the market appears firm.
Clicking the LIKE button is one of the best ways to support my research.
Disclaimer: These materials incorporate third-party data, are provided for informational purposes only, and do not constitute advice or opinion of any kind. Commodity Context does not warrant or guarantee the accuracy or completeness of these materials.
Chef's kiss. Thank you for sharing.
excellent