
North American Oil Data Deck (November 2025)
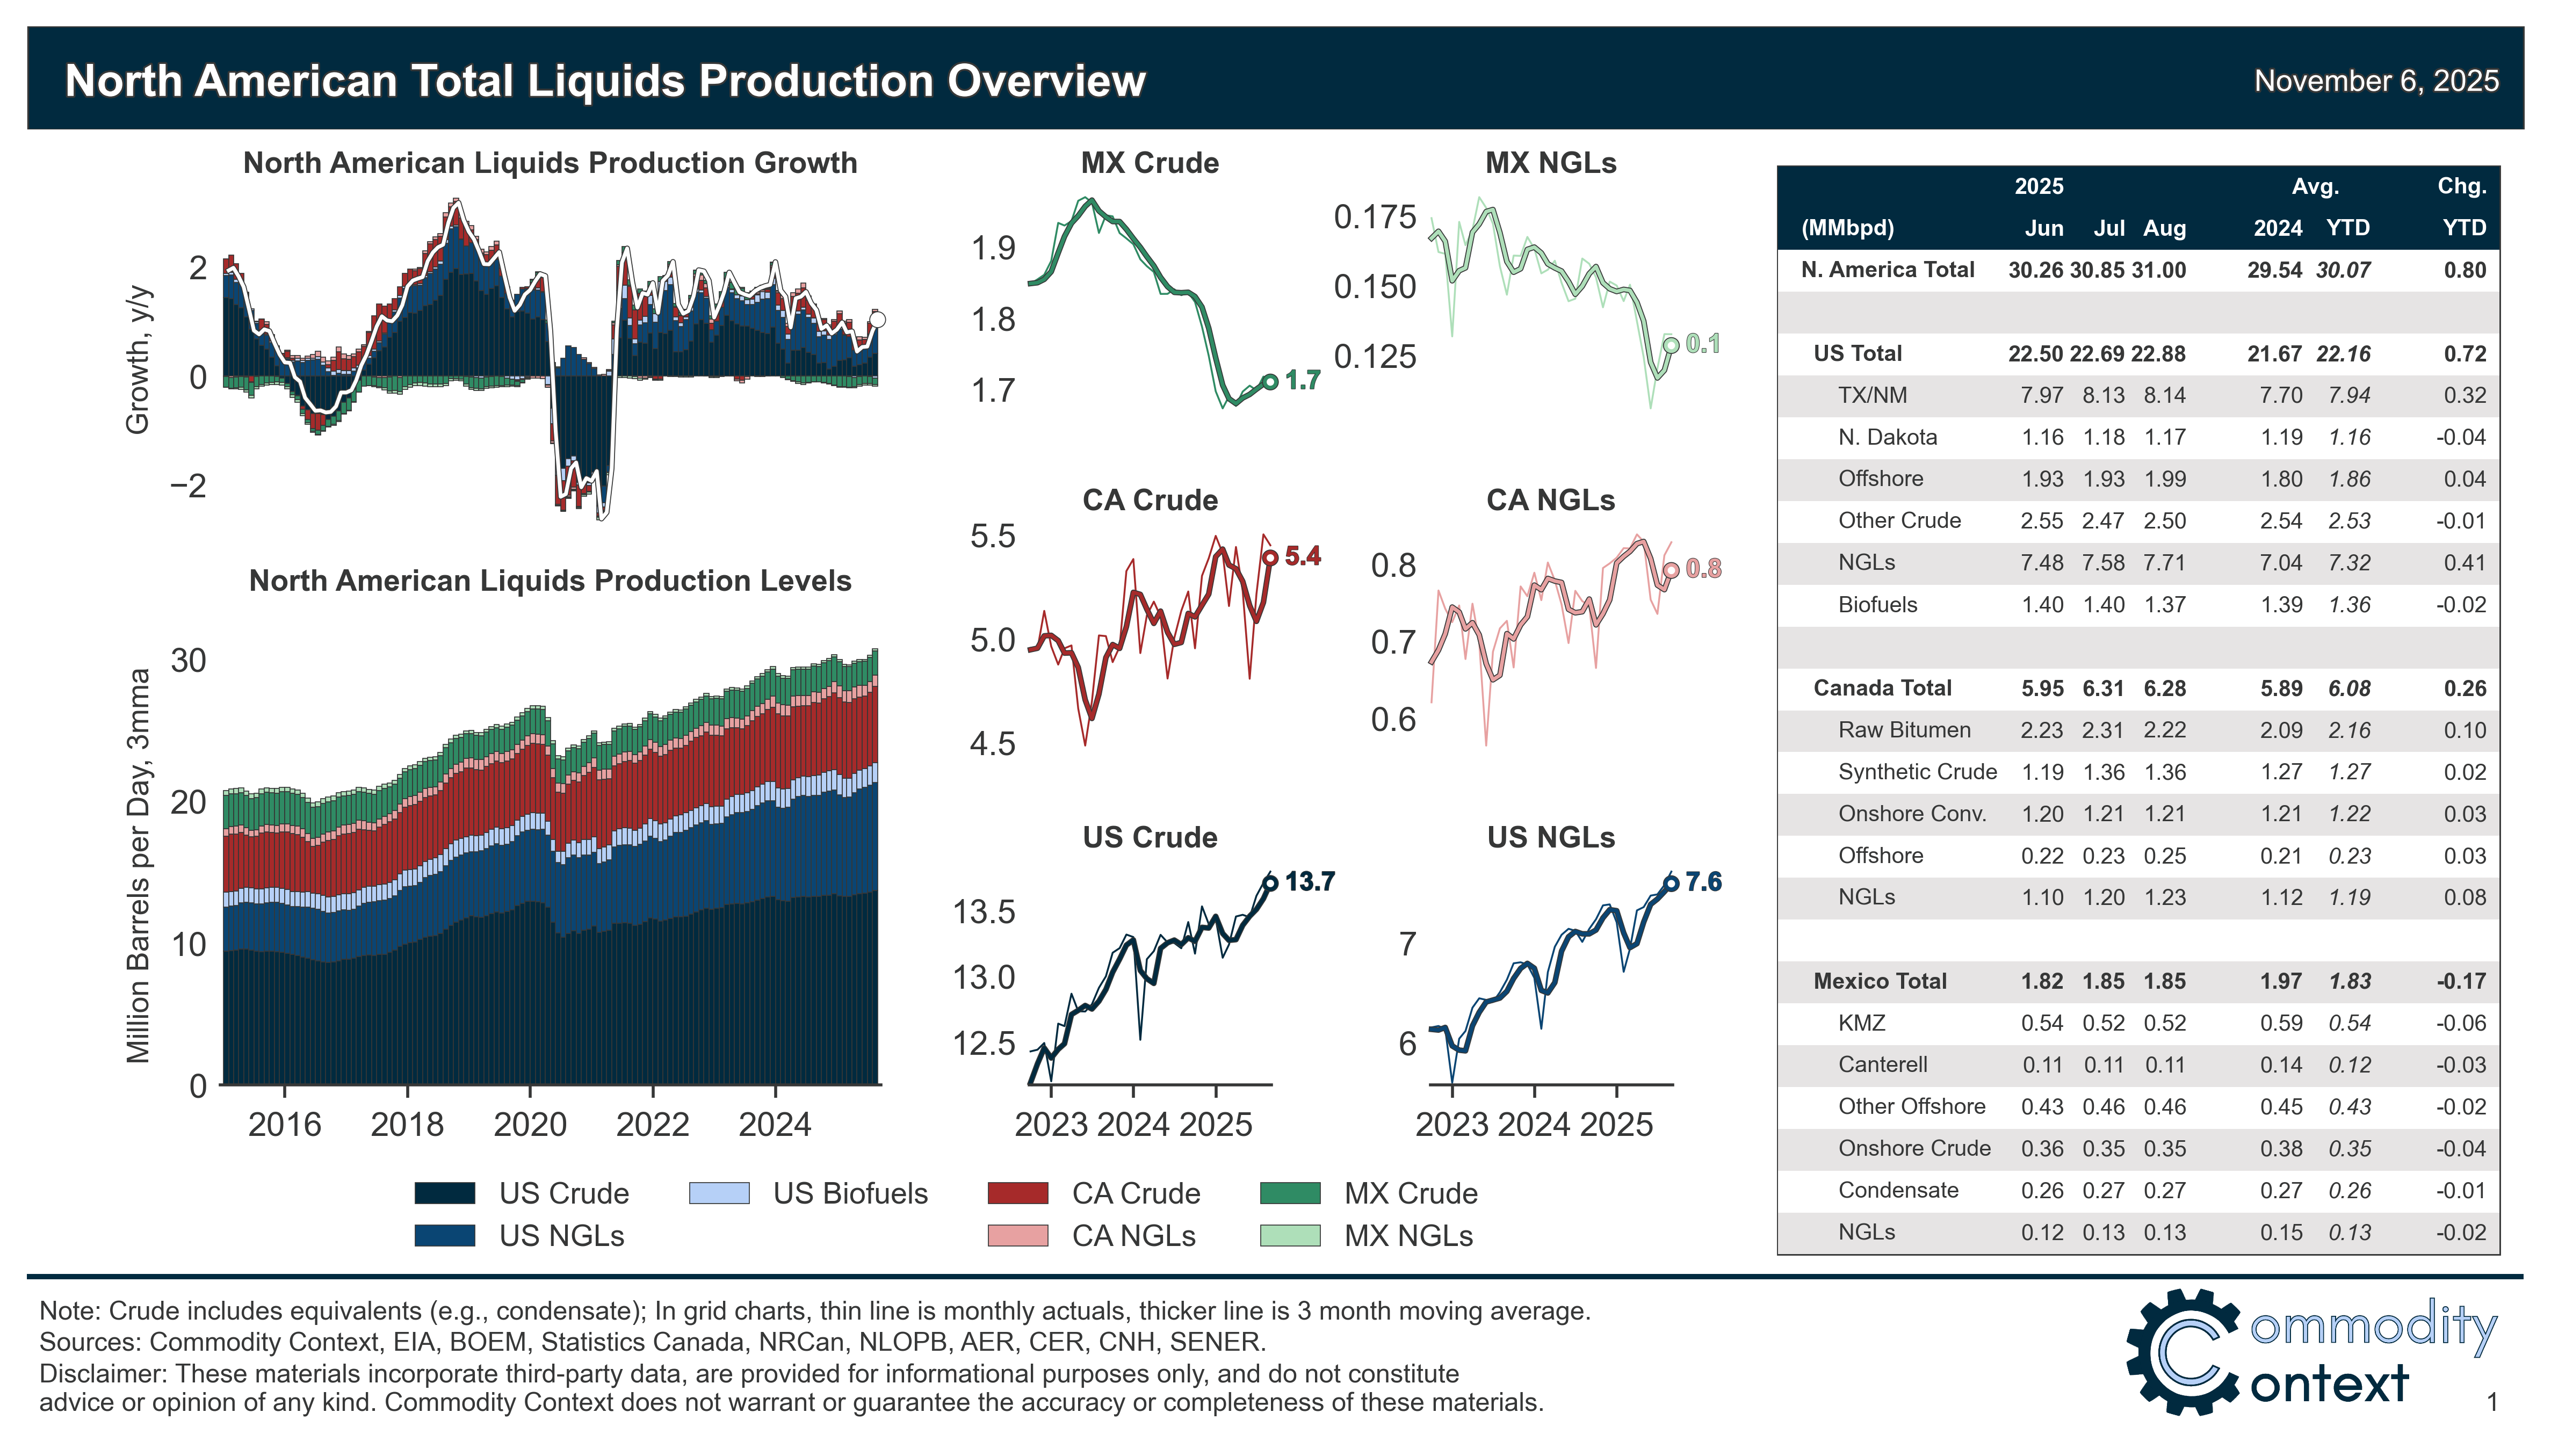
One more record production month for North America in August, with continental liquids output topping 31 MMbpd, while demand eased modestly across all three countries.

This 47-page November 2025 edition of my monthly data-dense, visualization-heavy North American Oil Data Deck is exclusive to paid Commodity Context subscribers (attached PDF below paywall). The deck contains detailed and decomposed accounting for US, Canadian, and Mexican upstream (i.e., production) and downstream (i.e., refining) oil activity as well as end-user demand.
This latest edition of the report also includes updated Canadian midstream egress (i.e., pipeline, port exports) exhibits that were published in Canada’s Zombie Pipeline earlier this week.
If you’re already subscribed and/or appreciate the free chart and summary, hitting the LIKE button is one of the best ways to support my ongoing research.

Summary
North American petroleum liquids production rose +151 kbpd m/m to hit yet another fresh all-time high of a clean 31,000 kbpd in August on the back of robust US-Canada growth, which, together, more than compensated for the steady, low-grade drag of Mexican output declines.
Continental demand, meanwhile, slipped both seasonally (-389 kbpd m/m) and on the year (-155 kbpd y/y) to 25,282 kbpd in August as all three countries registered modest declines compared to the same month last year.
[Full PDF Deck and Country-Level Analysis Below Paywall]