
Disunited Liquids Producers of America
A far from equal union of regions, geologies, and production methods

The data and analytical exhibits in this post provide a sneak-peak of the upcoming release of a second North America-focused Data Deck. See my latest Global Oil Data Deck to reference the depth and breadth of my oil and gas databases. Stay tuned!
If you like this type of numbers-driven state of play, consider becoming a paid subscriber today to access my full research suite:
If you’re already subscribed and/or like the free headline chart and bullets, hitting the LIKE button is one of the best ways of supporting my research.
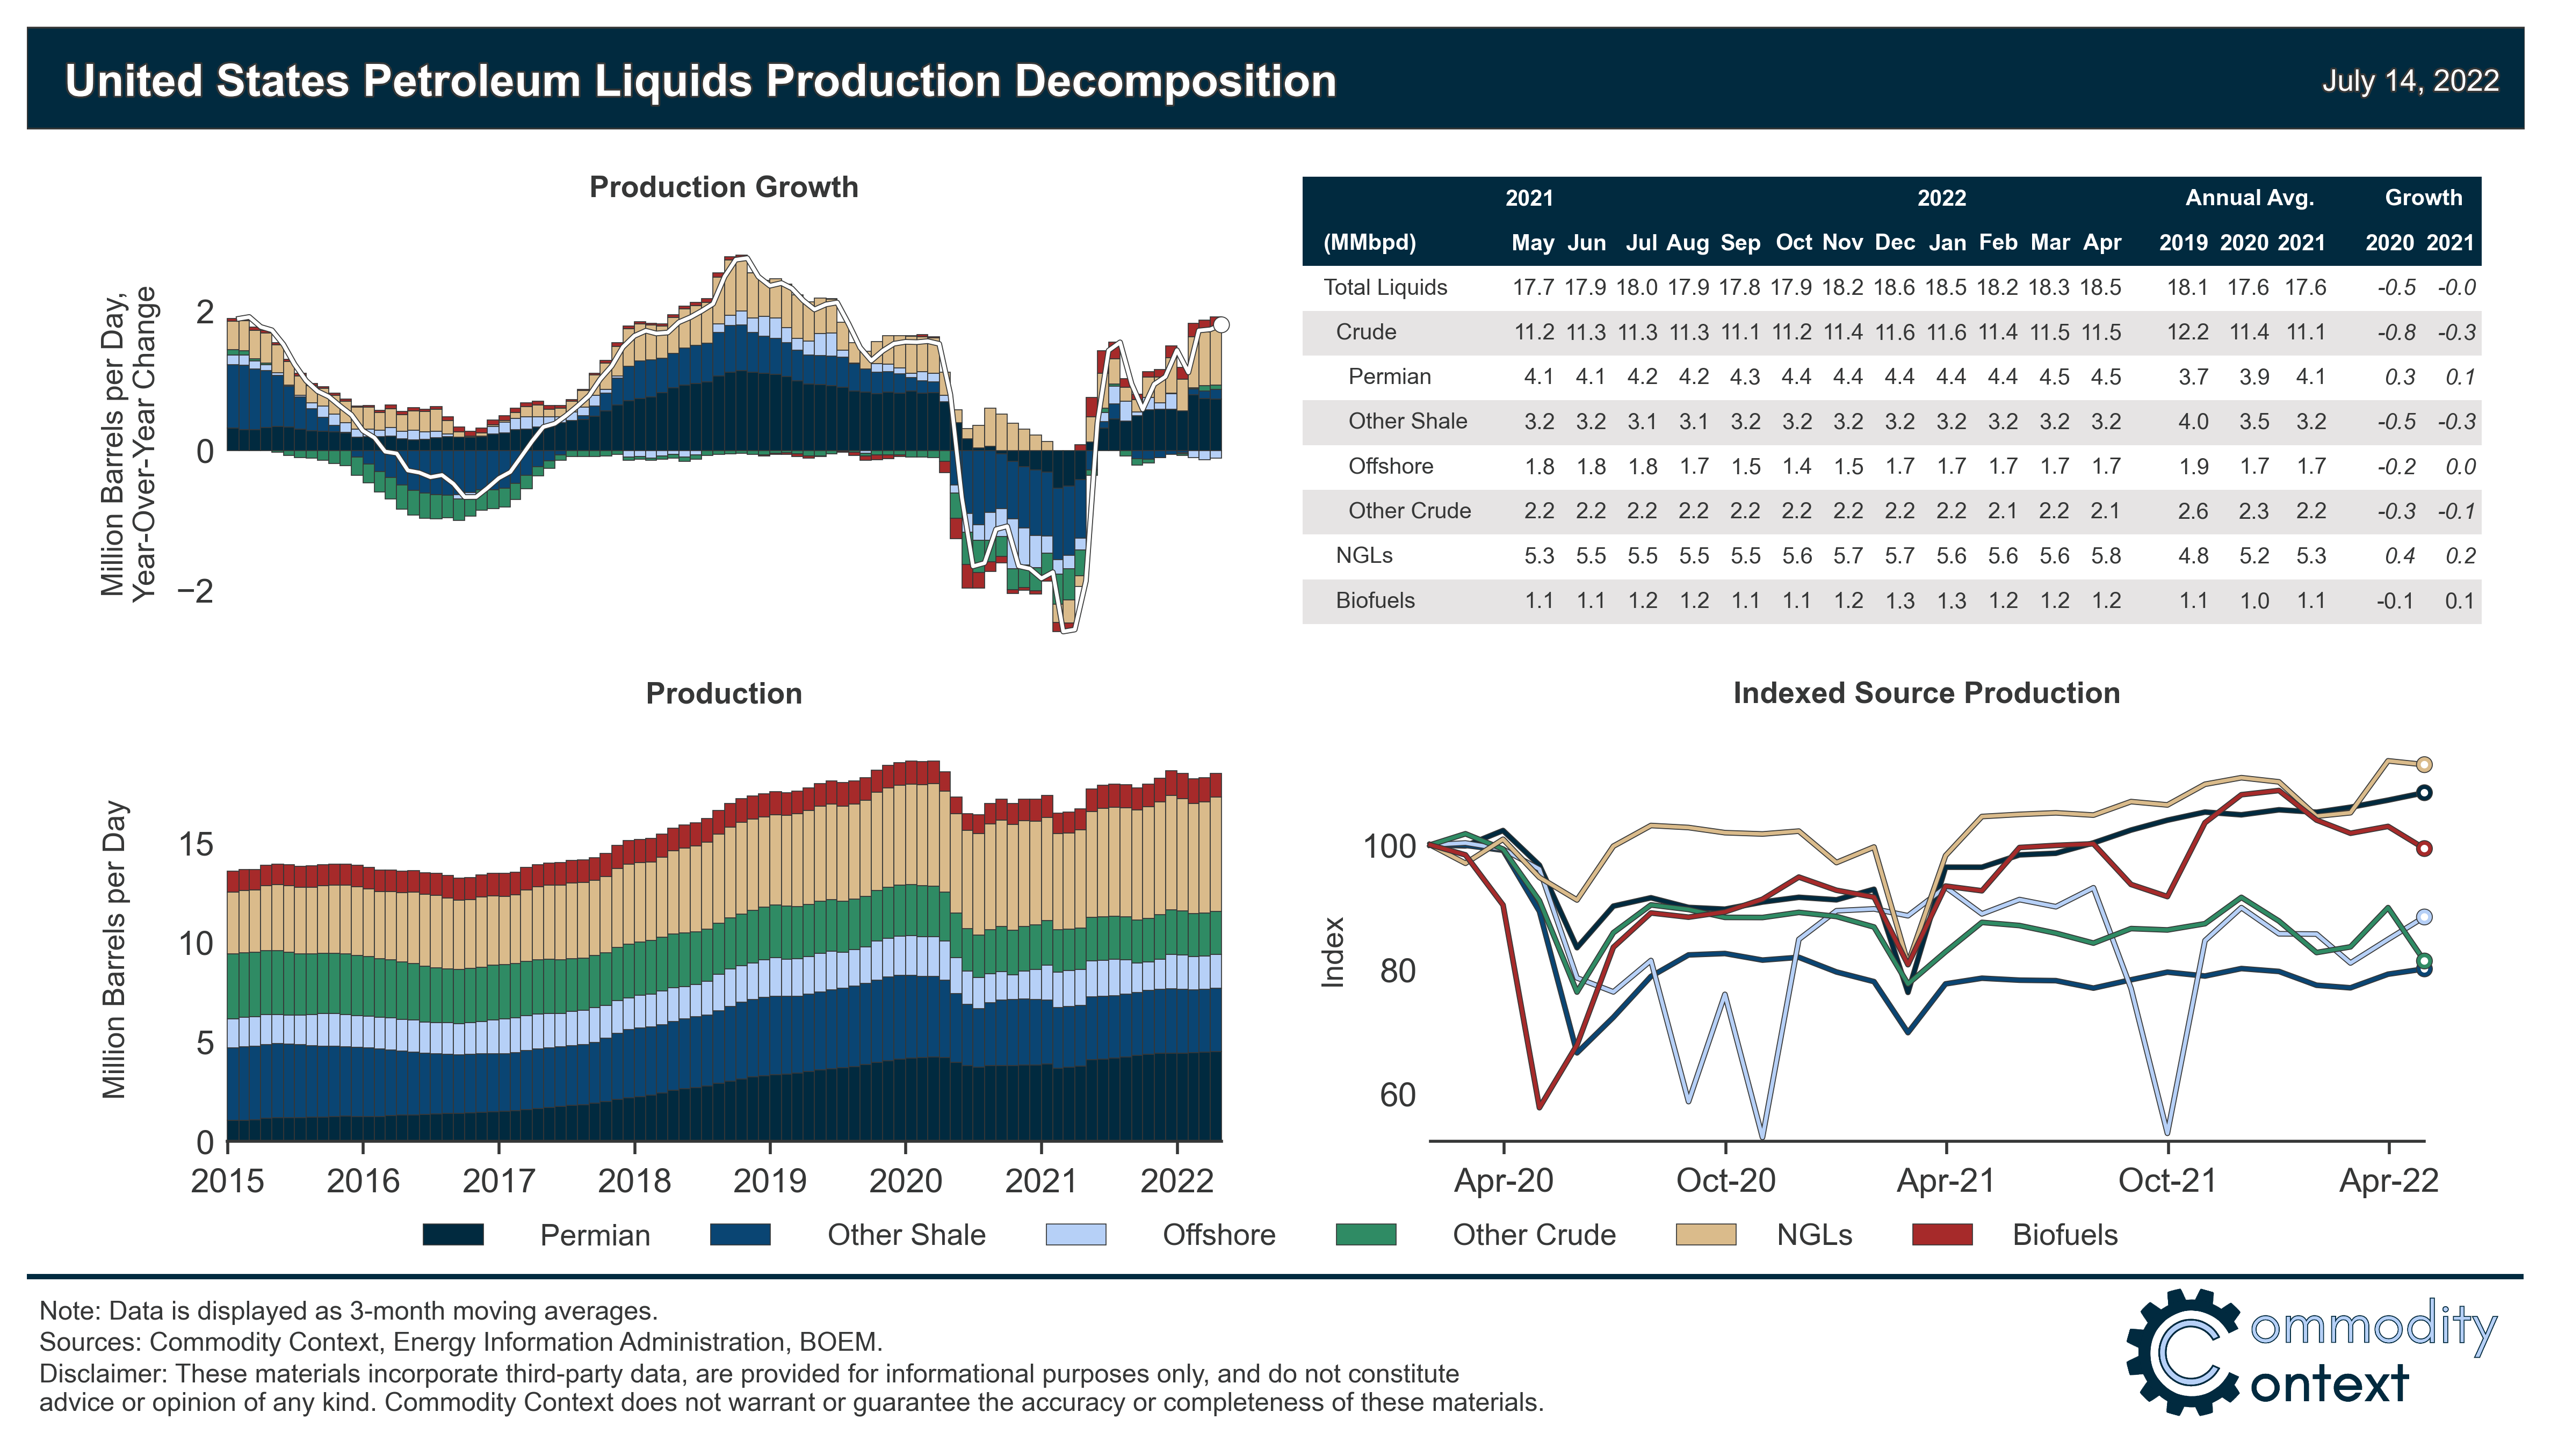
While US crude production remains more than a million barrels per day below pre-COVID levels, total liquids supply has recovered much quicker thanks to continued growth in NGLs and biofuels.
US tight oil production languishes 600 kbpd below March 2020 levels, but that’s split between roughly 200 kbpd of Permian growth and 800 kbpd of losses elsewhere in the US shale patch.
US offshore crude production is down 280 kbpd, but is expected to set fresh highs later this year and into next as major new projects enter service.
Natural gas liquids are far and away the outperformer within the US liquids complex, up 660 kbpd from pre-COVID levels on the back of continued fractionation capacity build-outs and robust demand from both domestic and export markets.
Biofuels are also up 150 kbpd relative to March 2020, but the engine of biofuel output growth has shifted from historical stalwart ethanol toward biofuels like renewable diesel, production of which has recently surged.
How much oil does the United States produce? It is difficult to overstate the centrality of this question to global oil markets. In the decade preceding the pandemic, US producers were responsible for more than two-thirds of supply growth—and now an even larger share of the go-forward expectation rests on the shoulders of the US shale patch. Yet, it’s trickier to put a number on it than you might expect at first glance.