

Below the paywall you will find the latest monthly edition of the Commodity Context OPEC+ Data Deck (50-page PDF), tracking groupwide and member-level official production estimates, quotas, compliance, exports, and official production data reconciliation vs output implied by visible movements.
If you’re already subscribed and/or like the free summary bullets, hitting the LIKE button is one of the best ways to support my research.
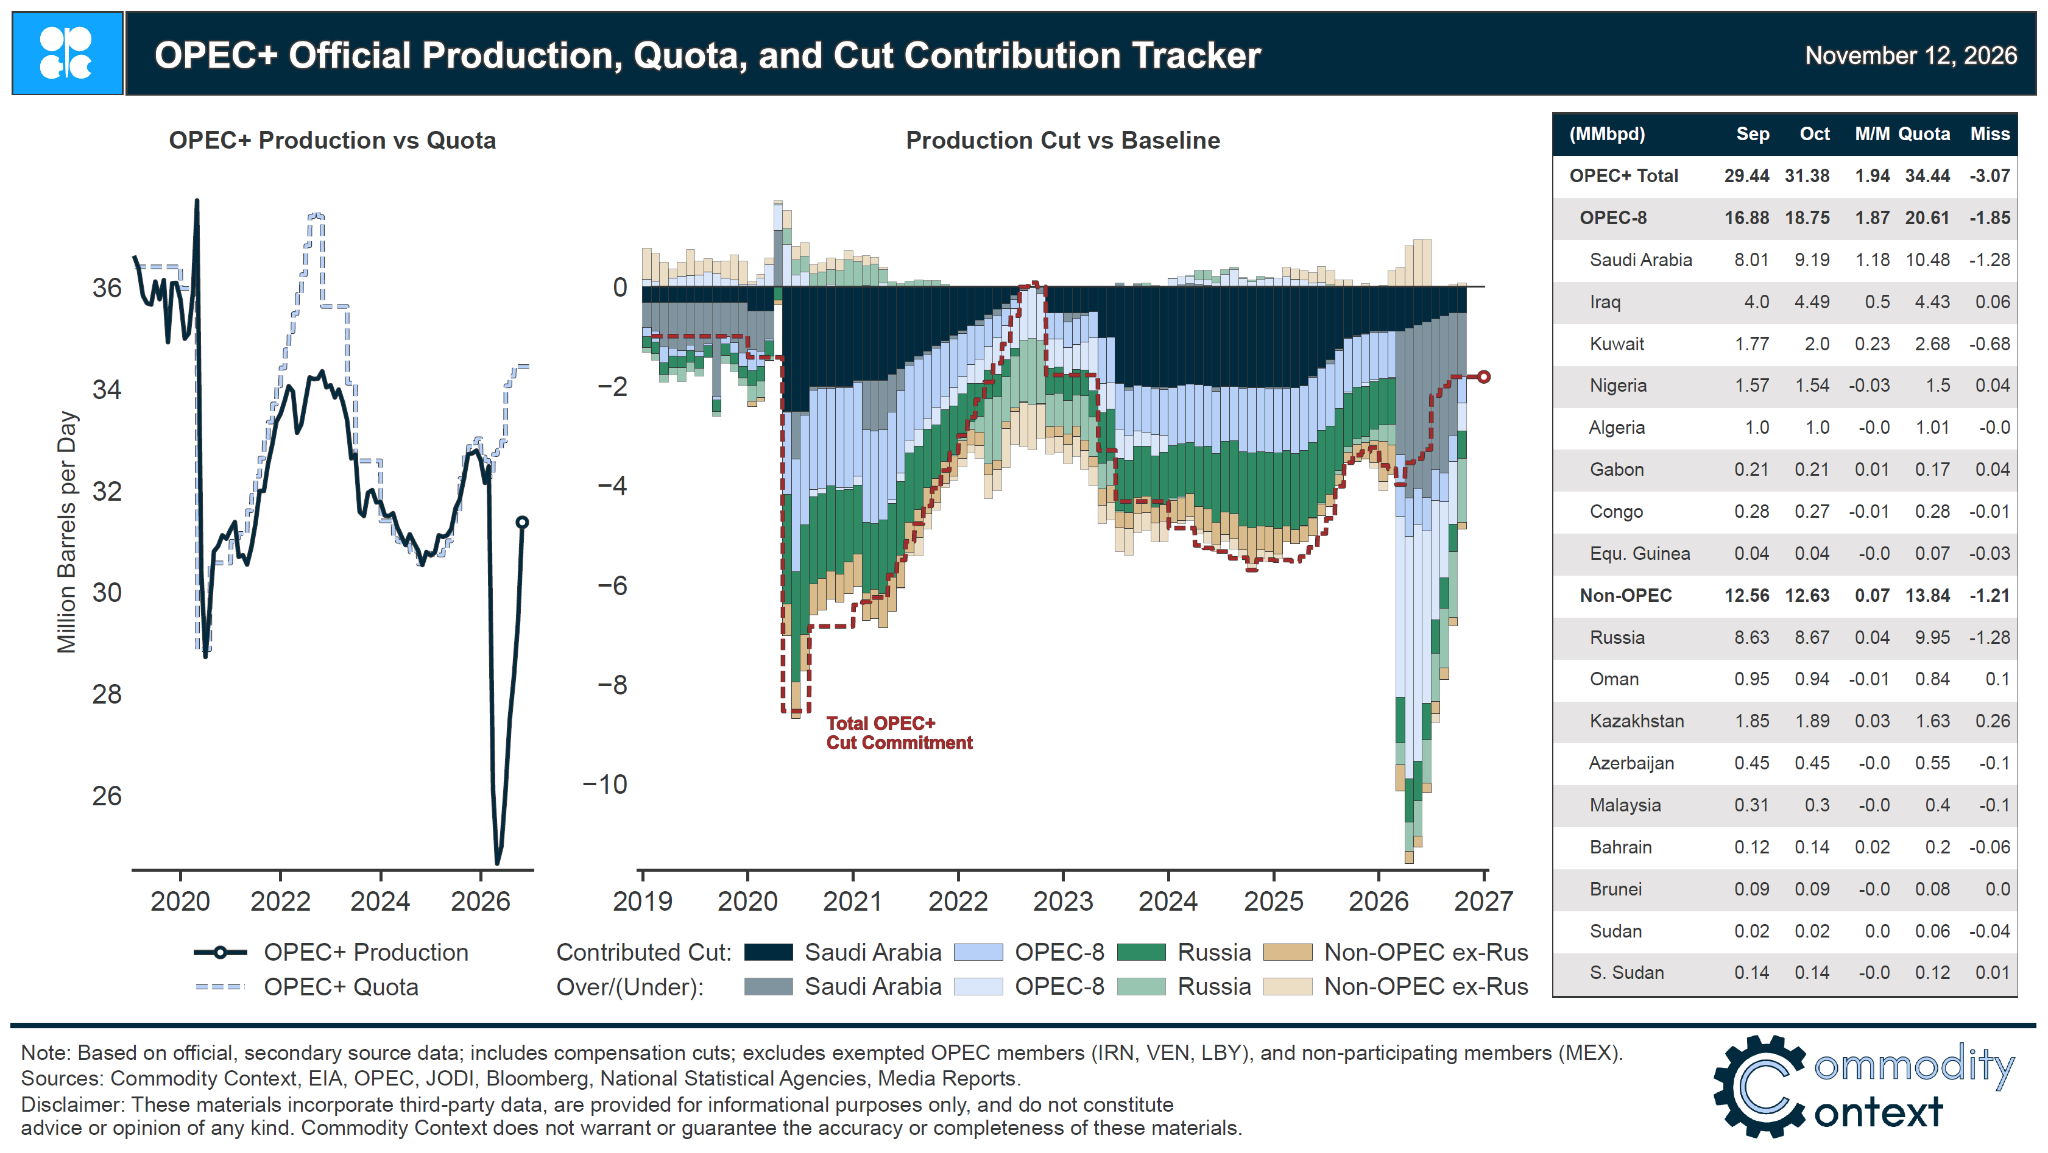
Quota-participating OPEC+ crude production raced higher by 1,945 kbpd in October according to official secondary source aggregate estimates published in OPEC’s Monthly Oil Market Report (MOMR), with the bulk of gains continuing to come from Saudi Arabia and Iraq, the latter of which is now reportedly producing more than 300 kbpd above February levels.
Quota-bound producers are now officially supplying to the market only 1.1 MMbpd less than February 2026 before the start of the Iran War, and Saudi Arabia’s self-declared production level (which is notably higher than this “supply to market”) closes the gap.
Iranian crude production fell to the lowest level since the 1980s as the US blockade continues to stifle Tehran’s ability to market its barrels.
Middle Eastern production rose to its highest level of the war in October, briefly touching prewar levels, but the recovery is unsteady and already appears to be partially retracing over recent weeks.
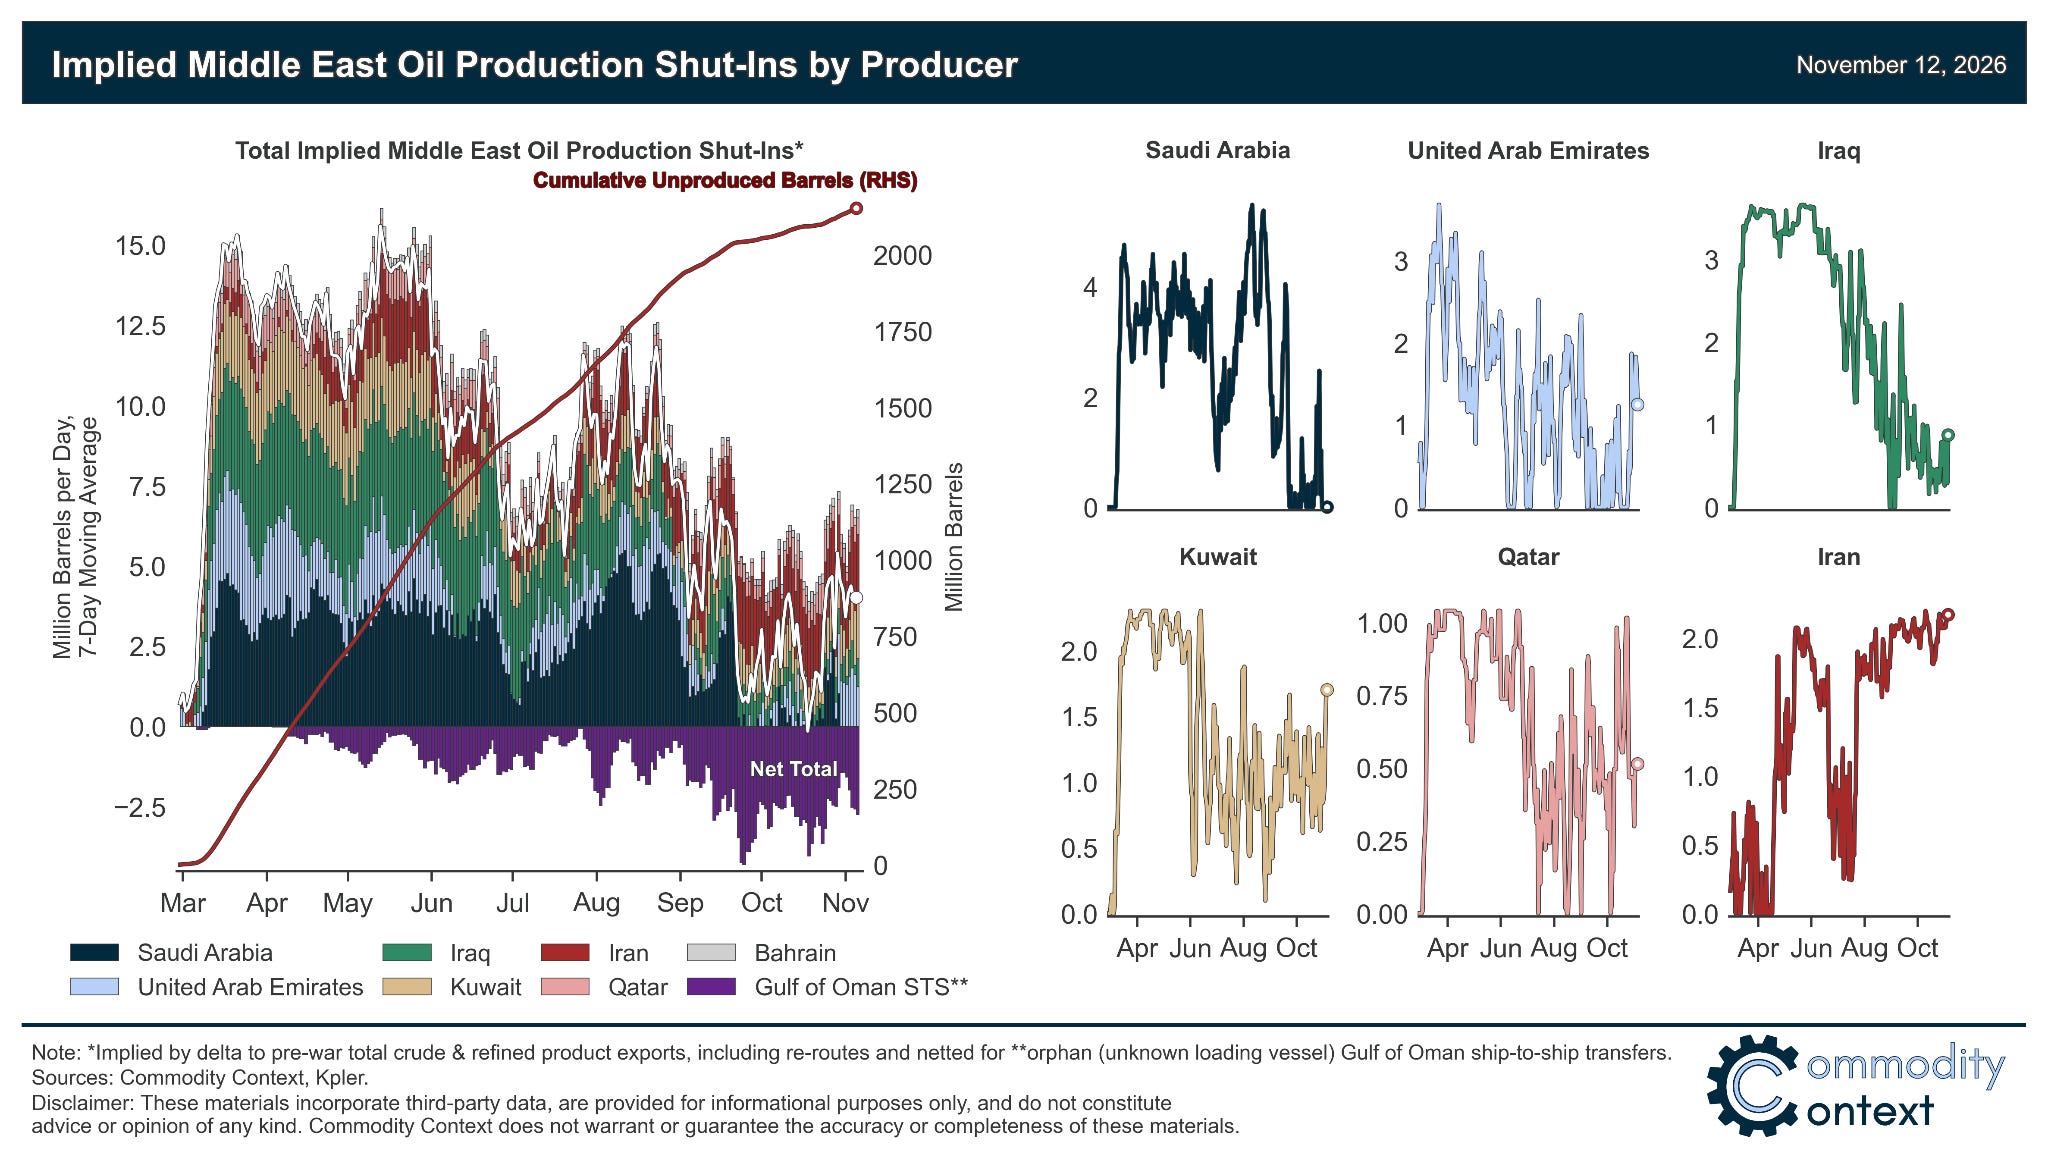
Middle Eastern implied oil production has risen substantially over the past three months, and as can be seen in the chart above briefly returned to roughly pre-war levels in late-October before pulling back. At latest count, implied production is some 3-4 MMbpd below prewar levels again following a pullback in observed Hormuz transits, but there remains a good chance that some of those volumes will be discovered on a lag so always treat recent estimates as an upper limit.
In the latest version of this chart we have netted the net implied production loss by the unidentified Gulf of Oman ship-to-ship transfers that guide our normal weekly tracking of Hormuz flows. At least in terms of total liquid supply, this is beginning to look more durably tolerable for the global oil market, though the costs and tanker market stresses of these dark transits remain unsustainably heavy.
[Full PDF Deck and additional analysis below paywall]