
Oil Context Weekly (W12)
Crude prices tentatively recover by $2/bbl alongside a halting recovery in sentiment related to ongoing banking sector concerns; truly historic scale of recent spec selloff revealed.

Happy Friday,
I recently discussed this latest banking sector-inspired oil rout with the Financial Post and you can check out the full conversation for free on YouTube here.
Every week, I summarize the developments in flat crude prices, calendar spreads, high-frequency inventories, refined products, and positioning data and then provide a taste of the themes I’m thinking about or following closely.
If you’re already subscribed and/or appreciate the free chart and summary, hitting the LIKE button is one of the best ways to support my ongoing research.
Summary
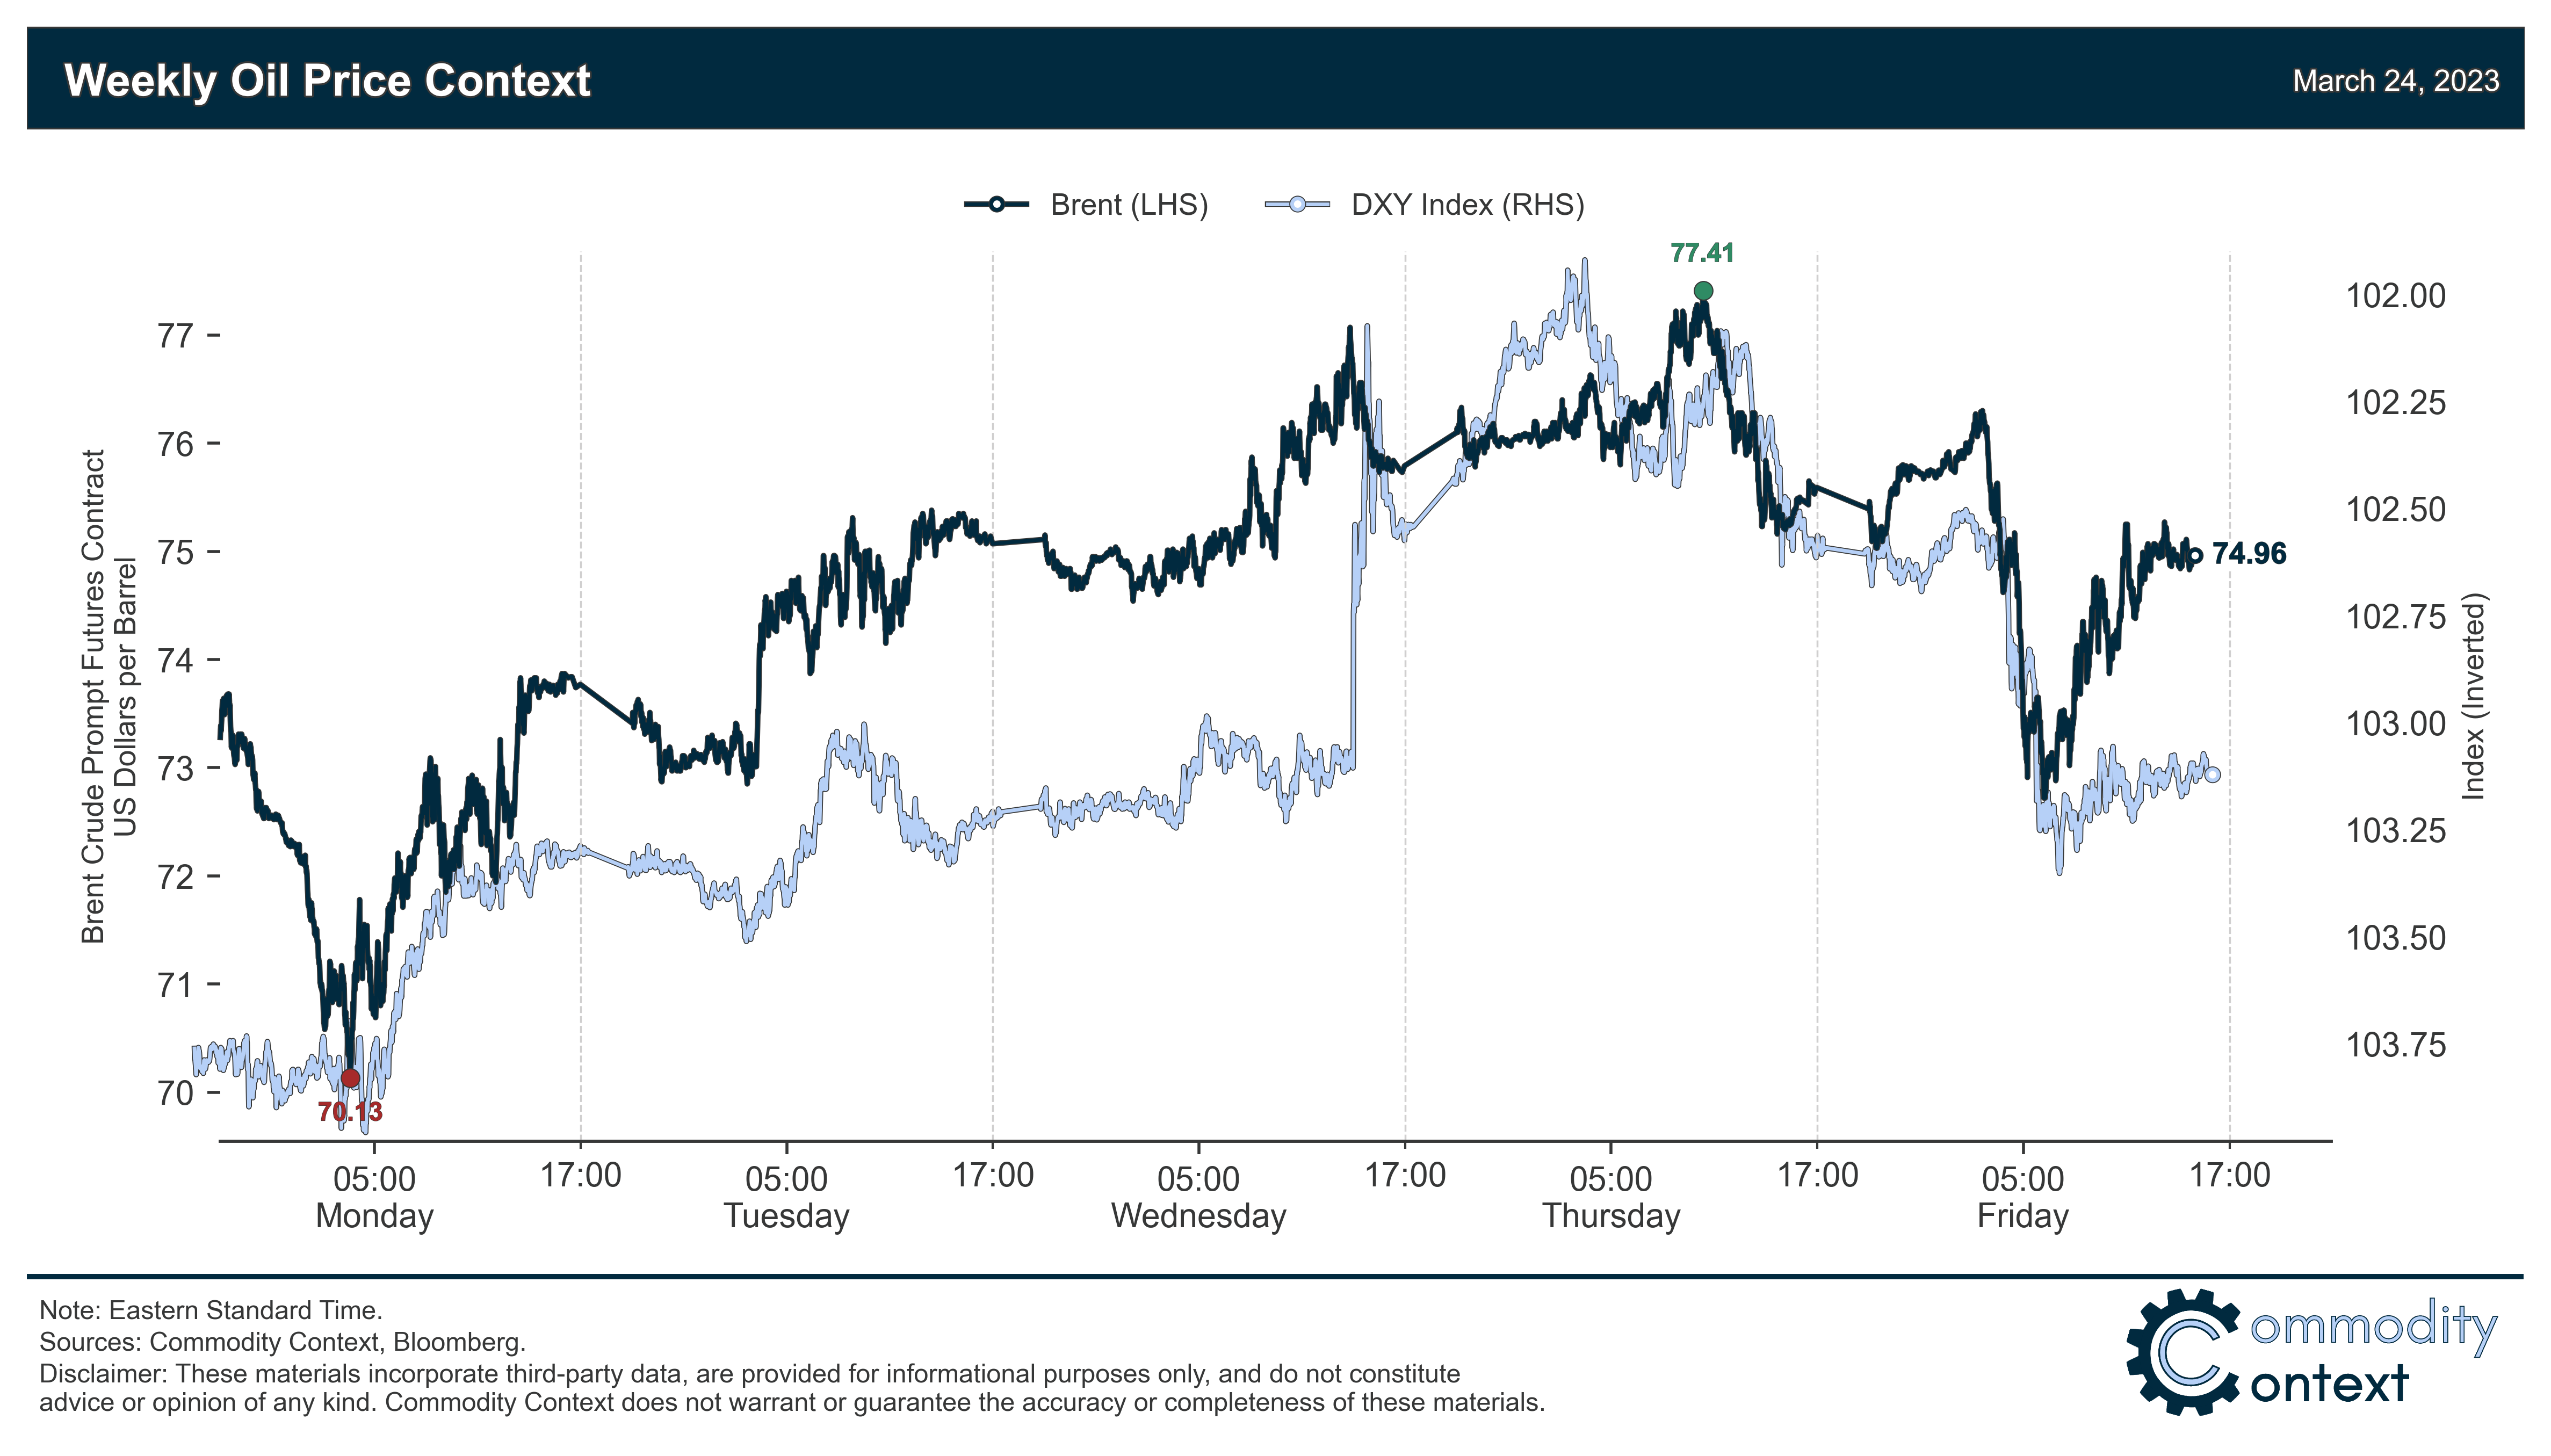
Flat Prices rose by ~$2/bbl over last week to $75/bbl Brent basis at the time of writing, with crude contracts still mostly trading in tight lockstep with both US equities and the Dollar; after falling to a banking crisis-low of nearly $70/bbl, prices rose to more than $77 on Thursday before falling back.
Calendar Spreads the bellwether Dec23/Dec24 spread moved in lockstep with flat prices, recovering through the early week and collapsing once again on Thursday through today; prompt spreads, meanwhile, are temporarily closer to the physical market and have been comparatively resilient vs the rest of the curve.
Inventories data was mixed globally but leaned bullish given the first honest-to-God bullish inventory draw of the year in the US, where total liquids stocks fell 10.4 MMbbl w/w driven by very large declines in gasoline (-6.4 MMbbl, biggest draw since Fall 2021) and diesel; ARA European product stocks rose 0.9 MMbbl w/w and Singapore printed another sizable 2.4 MMbbl build.
Refined Products prices were relatively uneventful when compared to the tumult in crude, with only mild gains in gasoline crack spreads on the back of sizable inventory draws and flat-to-down performance in diesel despite another stock draw and worsening refinery and port strikes in France.
Positioning data unsurprisingly confirmed another round of speculative crude selling through the week-ending-Tuesday, down another 116 MMbbl w/w, and the net speculative position as a share of total open interest fell to its lowest level since the depths of the initial COVID rout in 2020; these latest data put the truly historic scale of this latest selloff in perspective—the two-week percentage-point move in the net spec position (as a share of open interest) represented the largest decline on record at more than 5 %-points, compared to earlier spec routs that maxed out at around 3-4 %-points over two weeks (e.g., 2016, 2017, 2020).