

This 47-page September 2026 edition of my monthly data-dense, visualization-heavy North American Oil Data Deck is exclusive to paid Commodity Context subscribers (attached PDF below paywall). The deck contains detailed and decomposed accounting for US, Canadian, and Mexican upstream (i.e., production) and downstream (i.e., refining) oil activity as well as end-user demand.
If you’re already subscribed and/or appreciate the free chart and summary, hitting the LIKE button is one of the best ways to support my ongoing research.

North American petroleum liquids production rose +157 kbpd m/m to 31,242 kbpd in June, up +936 kbpd y/y, as a rebound in Canadian production from seasonal maintenance helped offset flagging upstream growth in the US.
Continental petroleum product consumption rose seasonally by +607 kbpd to 25,175 kbpd in June, but that was actually down 483 kbpd on the year thanks to across-the-board pullbacks in consumer gasoline demand amidst the high prices; overall consumer fuels faced a more notable slowdown while the demand for industrial fuels proved more resilient.
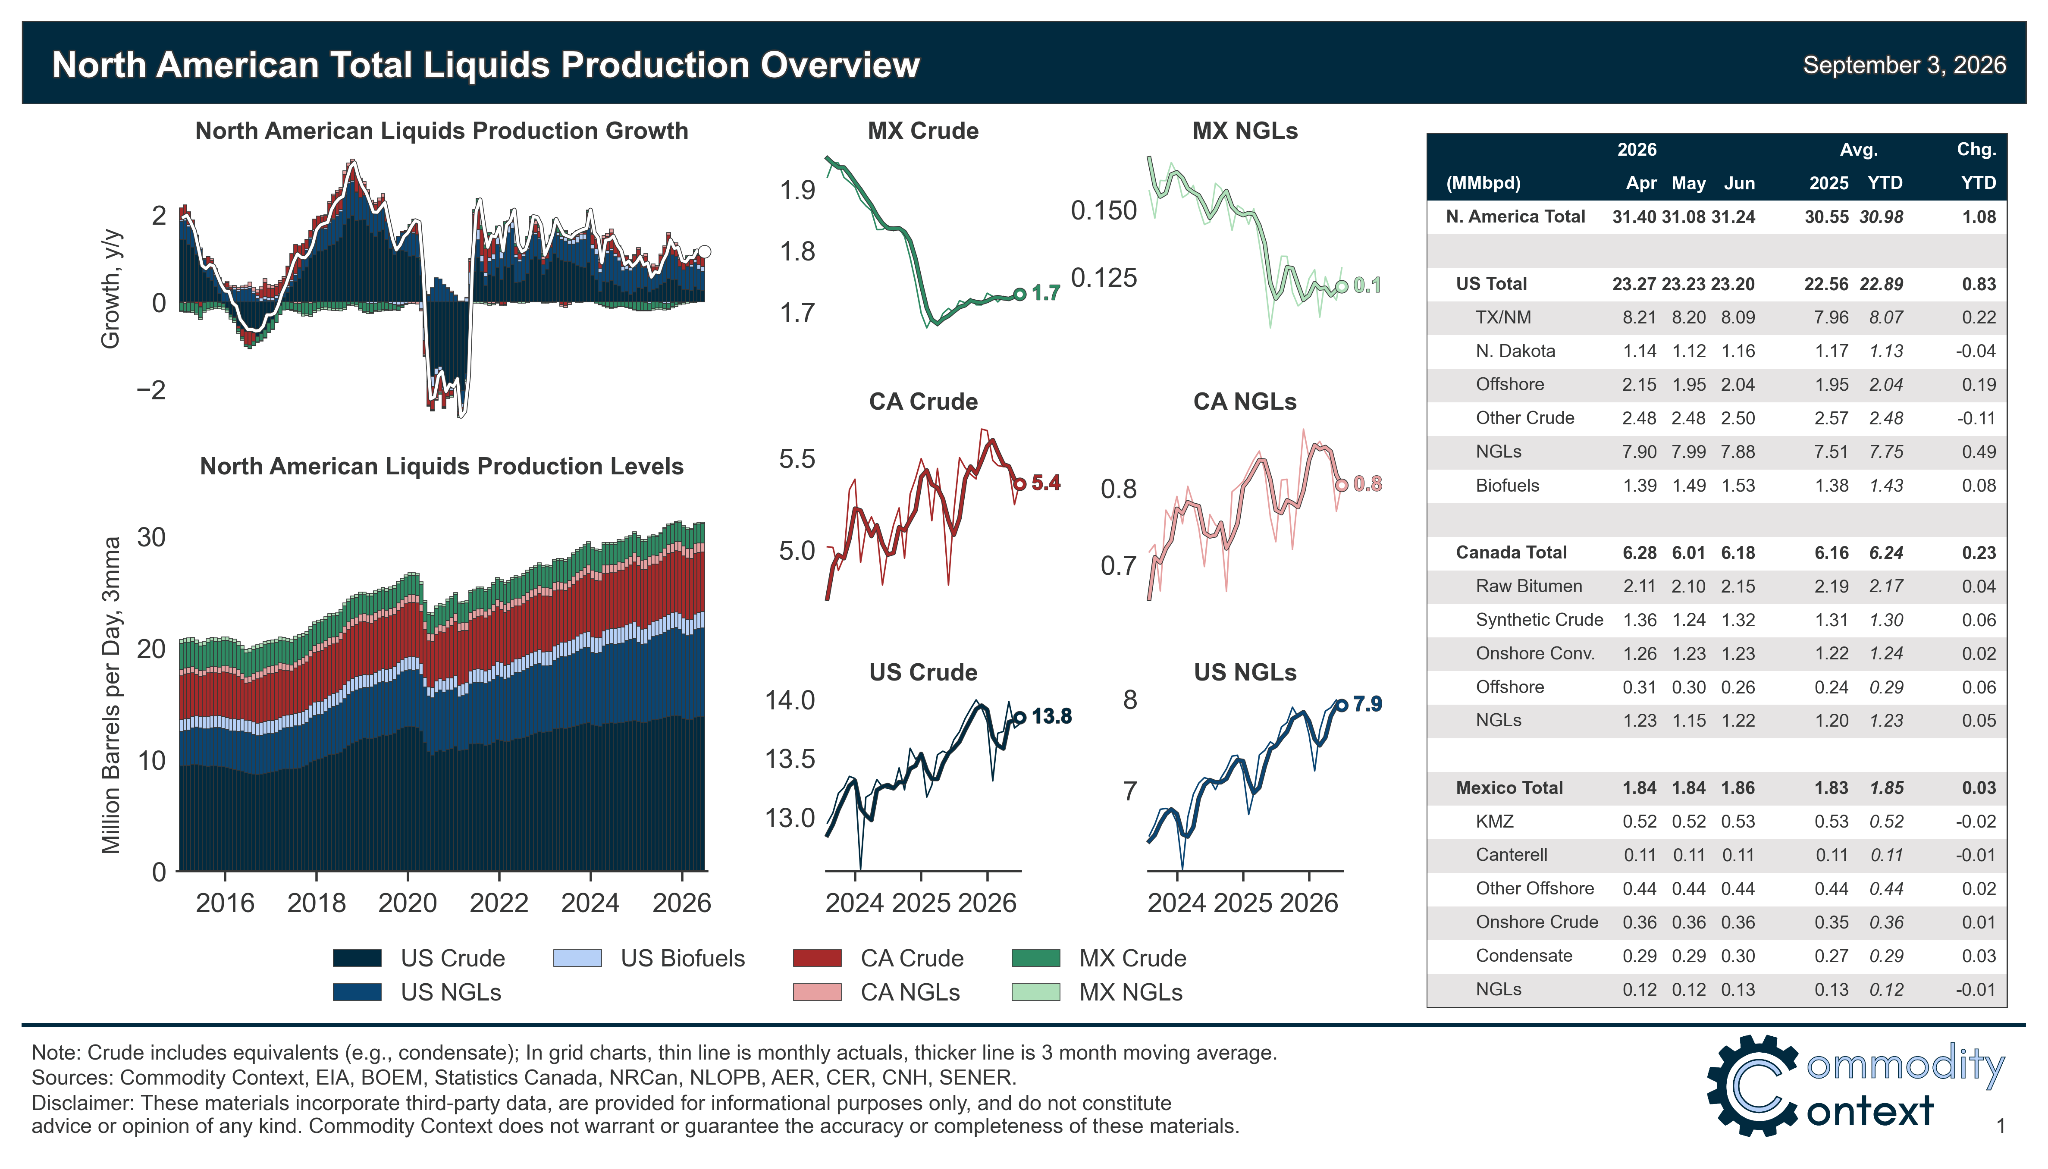
[Full PDF Deck and Country-Level Analysis Below Paywall]