North American Oil Data Deck (September ‘23)
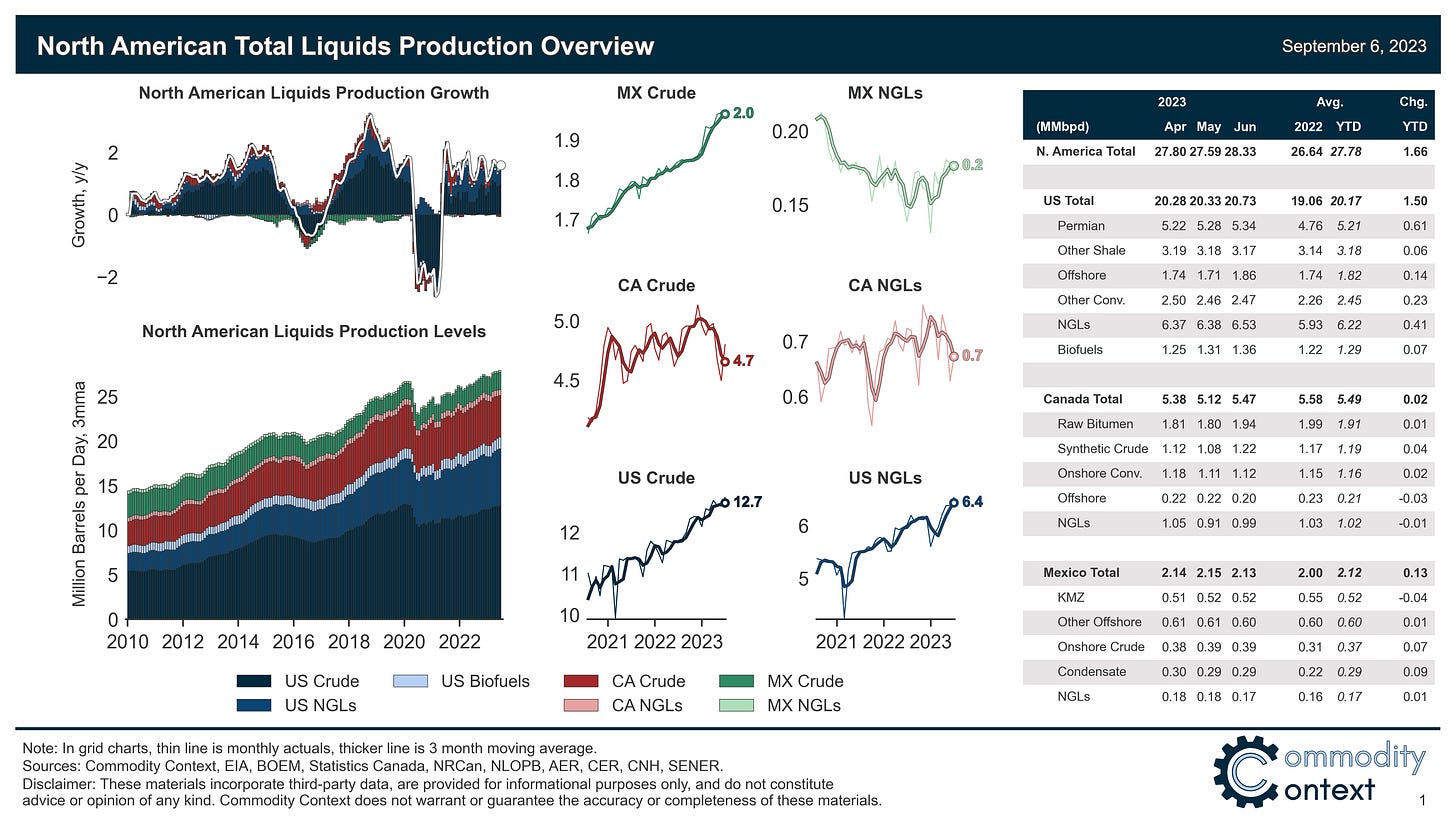
A fresh estimated continental liquids production record high in June was clouded by Canadian data omissions
This 33-page September 2023 edition of my monthly data-dense and visualization-heavy North American Oil Data Deck (attached PDF below paywall) is exclusive to paid Commodity Context subscribers. The deck contains detailed, decomposed accounting for US, Canadian, and Mexican upstream (i.e., production), downstream (i.e., refining) oil activity, and end-user demand.
If you’re already subscribed and/or appreciate the free chart and summary, hitting the LIKE button is one of the best ways to support my ongoing research.
North American total liquids production snapped back by nearly 750 kbpd m/m to a fresh all-time high of 28.33 MMbpd in June, driven by remarkably strong growth in the US and an [estimated] Canadian recovery from the wildfire and maintenance-related downturn in May.
North American refining throughput rose 164 kbpd m/m to 22.85 MMbpd in June—now up ~125 kbpd y/y—with gasoline and diesel both continuing to drive product output gains.
Continental demand continued to rise to 25.26 MMbpd (+266 kbpd), but still remains ~600 kbpd below the August 2019 high-water mark; it does sit higher than the direct June 2019 comparison, though.
NOTE—this report includes two material data developments:
1) United States: The US Energy Information Administration released new model changes—which had the net effect of reducing headline liquids demand—to address concerns discussed in Adjudicating the Adjustment (stay tuned for a closer look next week).
2) Canada: Alberta Energy Regulator data excluded production from Suncor due to submission issues discussed below, but the omission materially distorts June and July oil sands output readings and headline production figures need to be adjusted to make any sense.
(Full PDF report and country-level highlights included below paywall)


