

This 47-page October 2026 edition of my monthly data-dense, visualization-heavy North American Oil Data Deck is exclusive to paid Commodity Context subscribers (attached PDF below paywall). The deck contains detailed and decomposed accounting for US, Canadian, and Mexican upstream (i.e., production) and downstream (i.e., refining) oil activity as well as end-user demand.
If you’re already subscribed and/or appreciate the free chart and summary, hitting the LIKE button is one of the best ways to support my ongoing research.

North American petroleum liquids production rose +526 kbpd to 31,820 kbpd in July, +843 kbpd compared to the same month last year. While US crude production hit a fresh, all-time high in July, the overall pace of y/y continental output growth continues to decelerate despite the high price environment.
Refining runs across the continent are +207 kbpd y/y as refiner incentives (i.e., crack spreads) keep every facility pumping at full tilt for as long as owners can keep the facilities online.
North American petroleum product consumption rose (+241 kbpd m/m) seasonally in July; but, overall demand was down (-558 kbpd) as consumers retrenched amidst the exceptionally-high product pricing wrought by the Iran War and Russian refining crisis.
Western Canadian Select (WCS) crude differentials in Hardisty, Alberta, widened to more than $25/bbl under WTI and to more than $16/bbl in Houston, the widest levels since November 2023 and January 2023, respectively. This widening is being driven by both quality-related market weakness, connected to an increasingly oversupplied USGC fuel oil market, as well as the exploding cost of shipping given that marginal WCS barrels are exported to Asia.
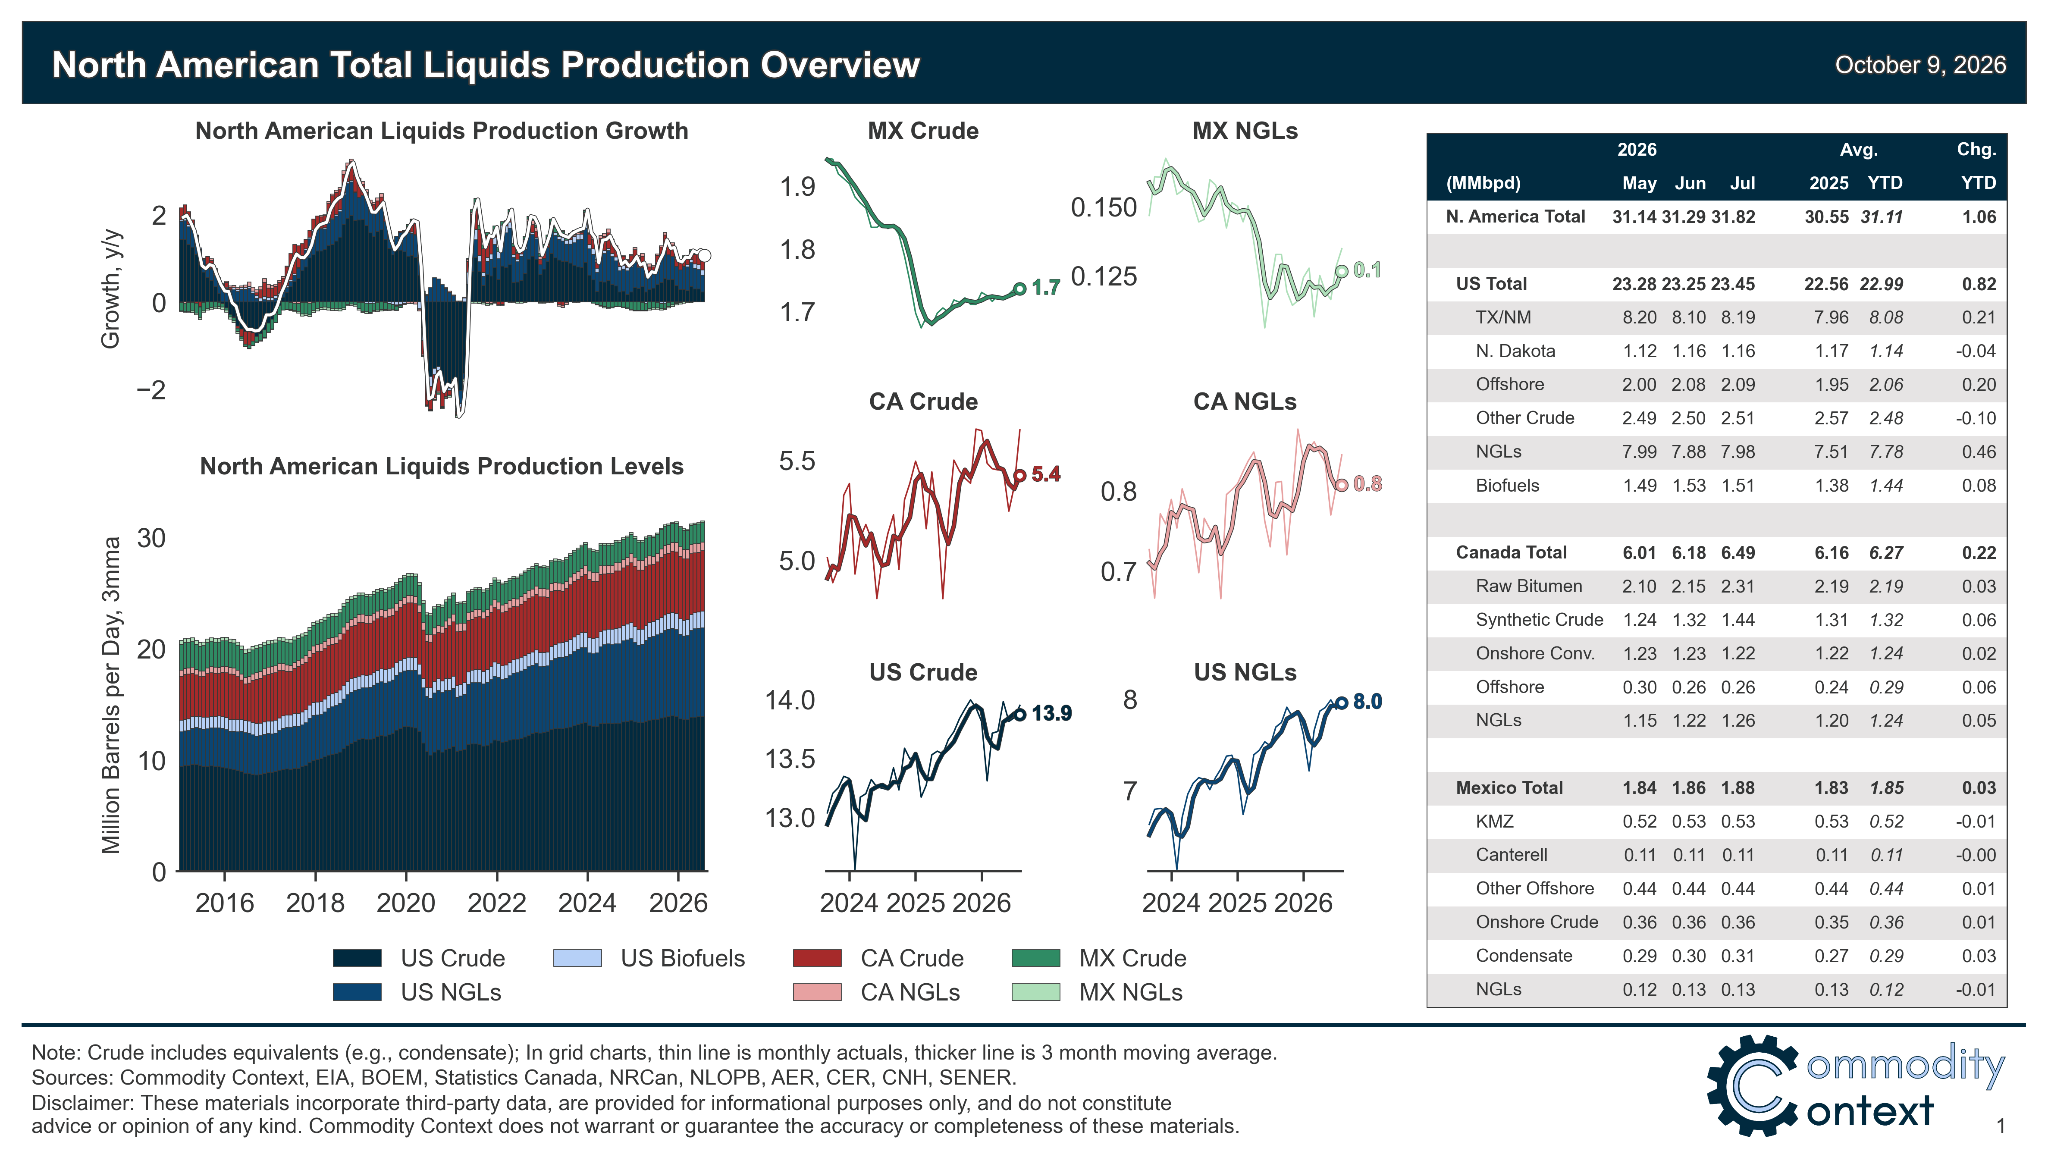
[Full PDF Deck and Country-Level Analysis Below Paywall]