
North American Oil Data Deck (October 2025)
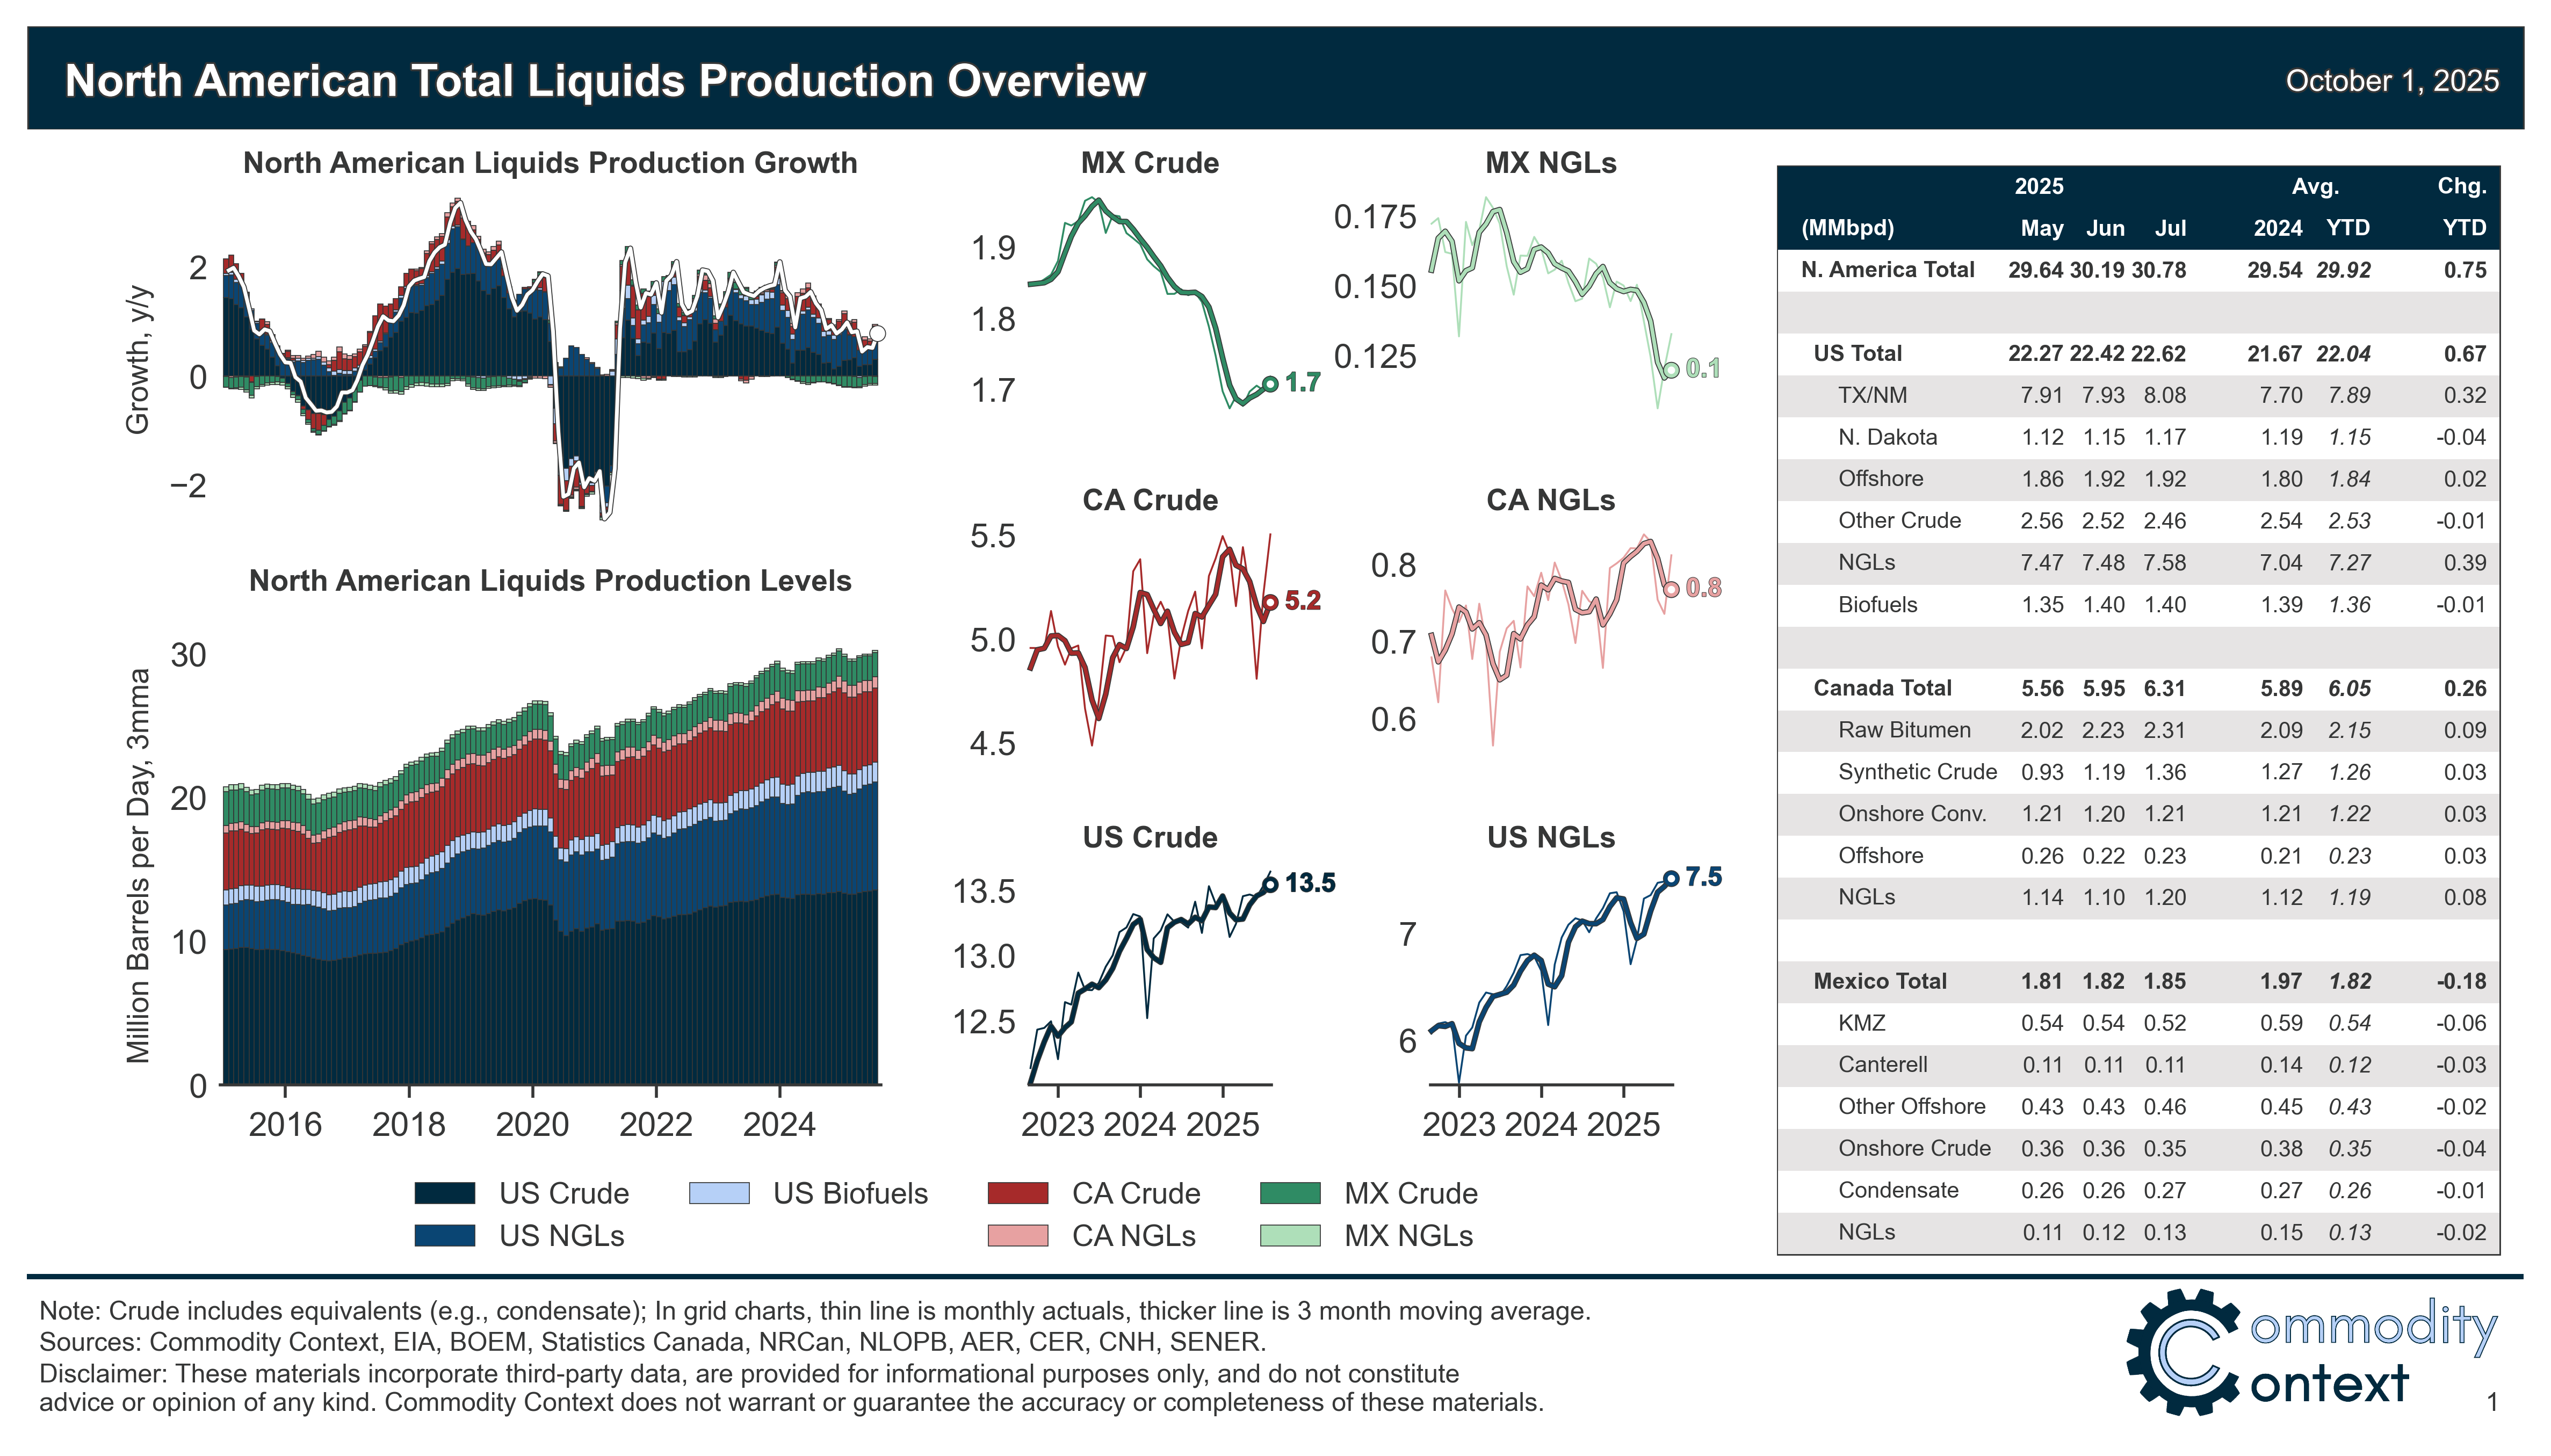
Another continental production record in July as both US shale & Canada’s oil sands reset fresh highs while demand was boosted by petrochemicals in the US and in Canada by record jet fuel consumption.

This 44-page October 2025 edition of my monthly data-dense, visualization-heavy North American Oil Data Deck is exclusive to paid Commodity Context subscribers (attached PDF below paywall). The deck contains detailed and decomposed accounting for US, Canadian, and Mexican upstream (i.e., production) and downstream (i.e., refining) oil activity as well as end-user demand.
If you’re already subscribed and/or appreciate the free chart and summary, hitting the LIKE button is one of the best ways to support my ongoing research.

Summary
North American petroleum liquids production rose by +598 kbpd m/m to 30,785 kbpd in July (+1,245 kbpd y/y)—a new all-time high!—on the back of resurgent output in both the US shale patch and Canada’s oil sands, each of which saw production hit fresh highs. Together, US and Canadian gains more than compensated for the ongoing and long-running contraction in Mexican crude output.
Continental petroleum product demand also strengthened (+433 kbpd y/y) due to a surge in the US consumption of natural gas liquids, which pushed headline US demand growth to 4x its trailing annual rate; meanwhile, Canadian jet fuel demand rose to all-time highs.
[Full PDF Deck and Country-Level Analysis Below Paywall]