North American Oil Data Deck (October ‘22)
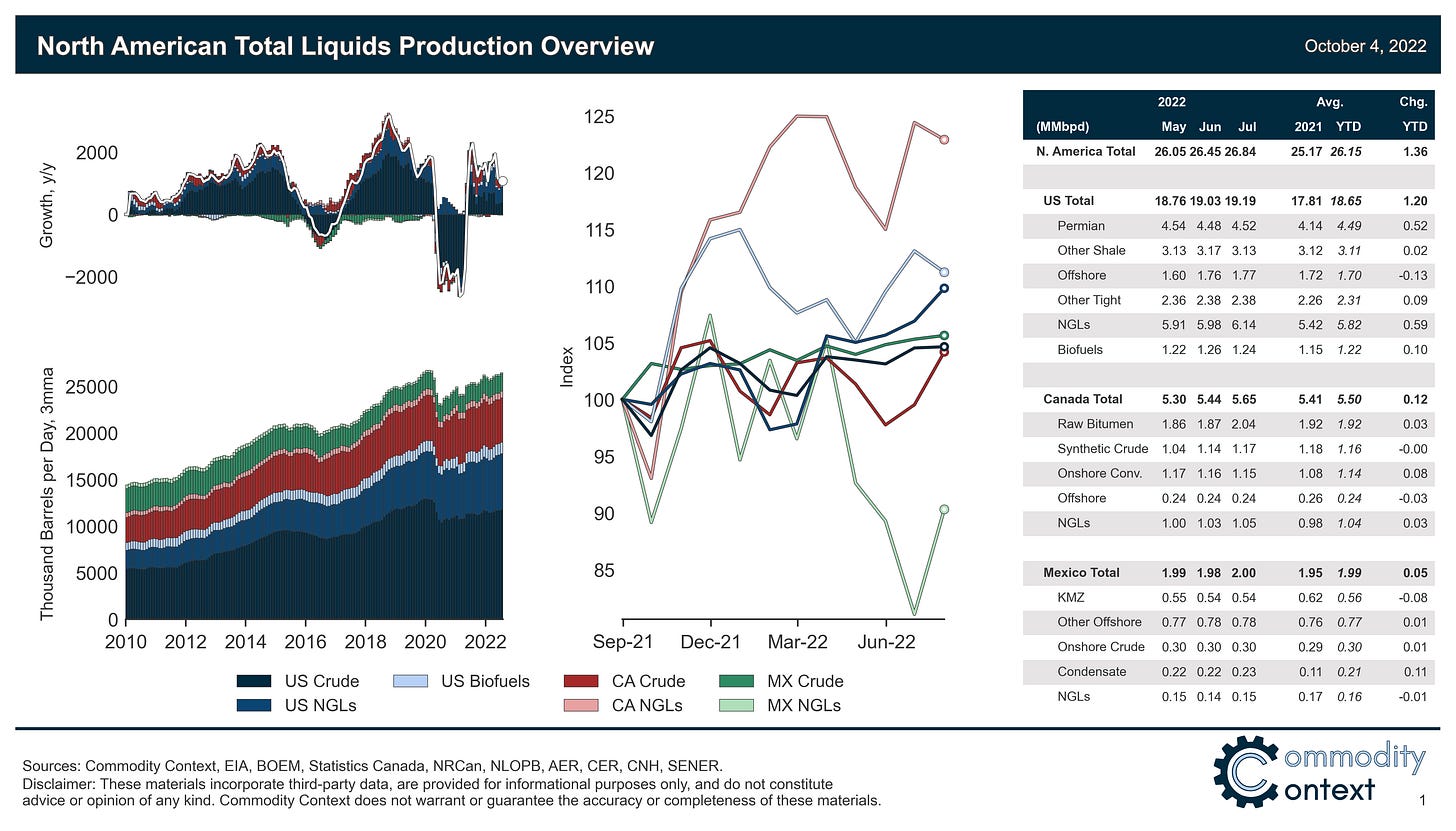
Continental liquids production reached an all-time high in July, surpassing the pre-COVID high-water mark; however, the composition of that production has shifted considerably.
This 24-page October 2022 edition of my monthly data-dense and visualization-heavy North American Oil Data Deck (attached PDF below paywall) is exclusive to paid Commodity Context subscribers.
The deck contains detailed, decomposed accounting of Canadian, US, and Mexican upstream oil activity (i.e., the production side), and I plan to add trade flow analysis to future editions, before moving on to domestic demand and refinery activity.
As always, I appreciate your feedback and suggestions for monthly additions.
If you’re already subscribed and/or appreciate the free chart and summary, hitting the LIKE button is one of the best ways to support my ongoing research.
North American total liquids production set a definitive, fresh all-time high of 26,841 kbpd in July (+386 m/m, +1,364 YTD y/y), outstripping the 26,759 kbpd reached in December 2019.
However, the composition of that liquids output is starkly different: crude output is still 1.1 MMbpd lower relative to December 2019 levels while the production of NGLs is 1.12 MMbpd higher.
Continental crude output gains (+238 m/m, +663 YTD y/y) were concentrated in Canada on the back of a recovery from in-situ oil sands maintenance.
NGL production continues to be a North American output growth heavy hitter (+169 m/m, +598 YTD y/y), with the bulk of that coming from the US and even a monthly gain in Mexico (offsetting a smaller monthly decline in Canada).


