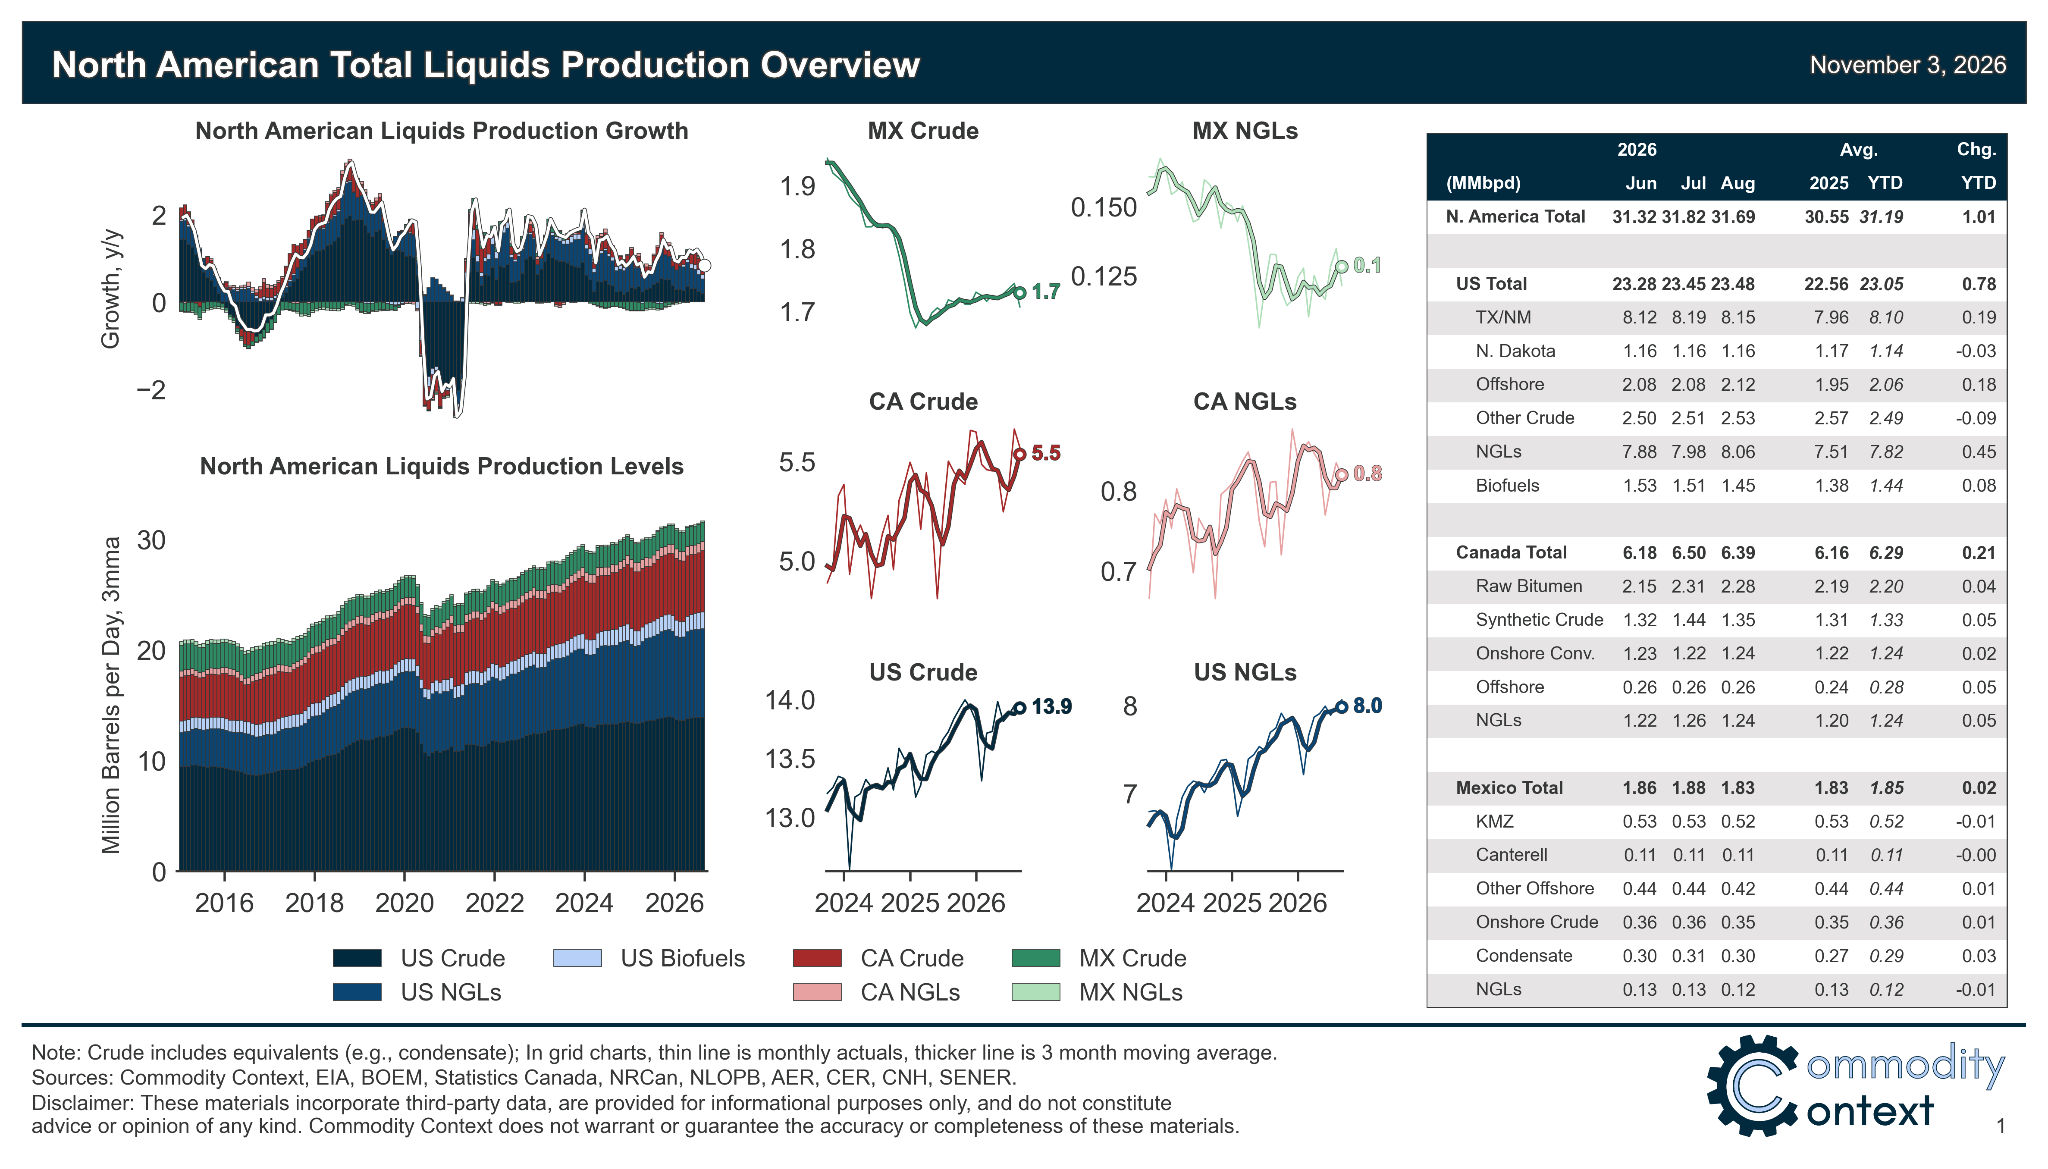
This 47-page November 2026 edition of my monthly data-dense, visualization-heavy North American Oil Data Deck is exclusive to paid Commodity Context subscribers (attached PDF below paywall). The deck contains detailed and decomposed accounting for US, Canadian, and Mexican upstream (i.e., production) and downstream (i.e., refining) oil activity as well as end-user demand.
\If you’re already subscribed and/or appreciate the free chart and summary, hitting the LIKE button is one of the best ways to support my ongoing research.

North American liquids supply contracted by -127 kbpd m/m to 31,791 kbpd in August, up +642 kbpd y/y and down from a trailing annual average growth pace of +1,055 kbpd y/y. The monthly decline was driven largely by a pullback in Canadian output and Mexico’s return to contraction, while the broader structural slowdown remains overwhelmingly a story of dragging US crude production gains.
Western Canadian Select (WCS) crude differentials in Hardisty, Alberta reached their widest level since the all-time record blowout of 2018, this time driven not by insufficient pipeline capacity but rather by record discounts borne by Canadian barrels on both the West and US Gulf coasts.