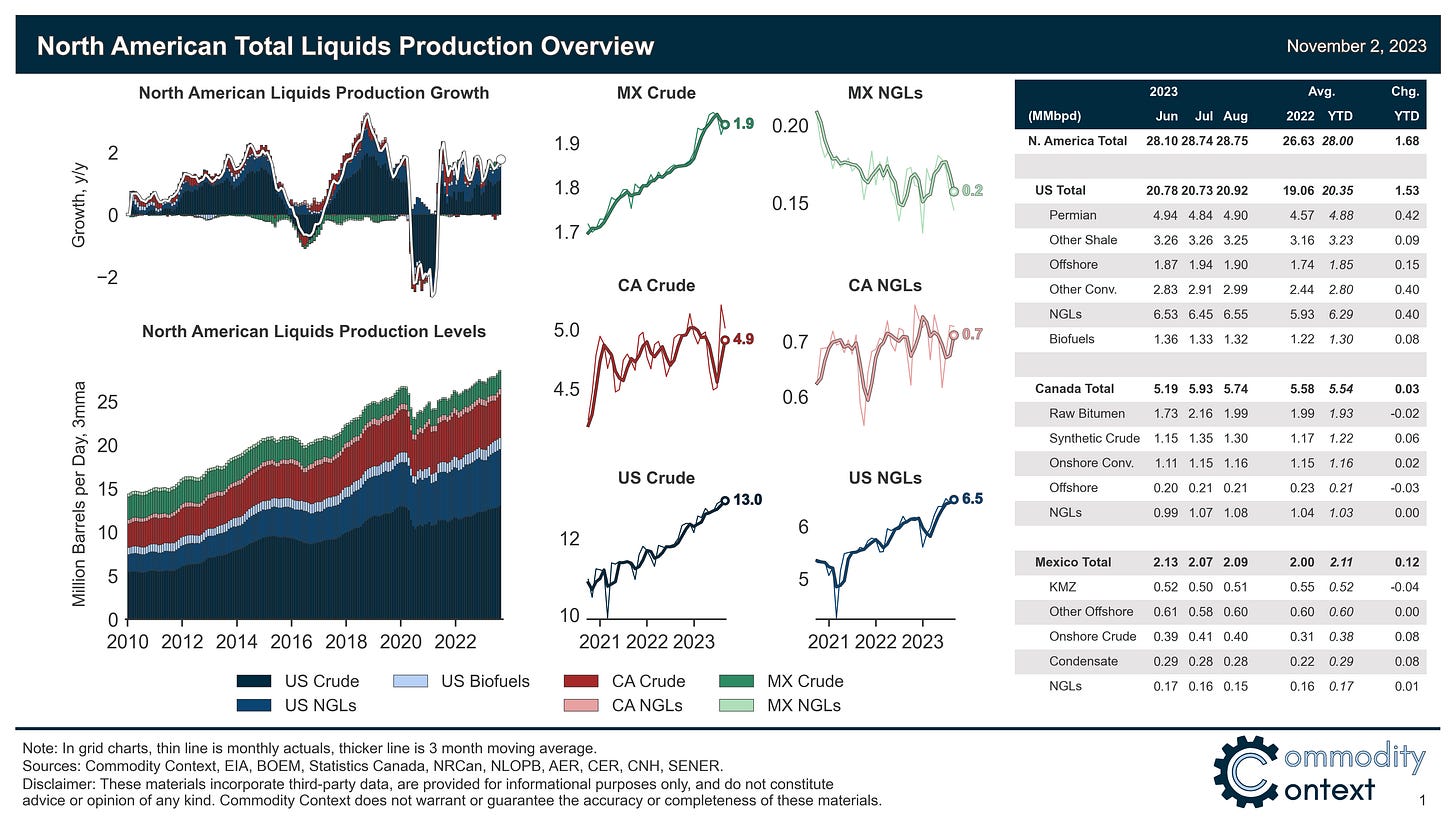
North American Oil Data Deck (November ‘23)
Continental petroleum liquids output narrowly sets another fresh all-time high as US crude production finally sets a new high-water mark, offsetting a pullback in Canadian output.
This 33-page November 2023 edition of my monthly data-dense and visualization-heavy North American Oil Data Deck (attached PDF below paywall) is exclusive to paid Commodity Context subscribers. The deck contains detailed, decomposed accounting for US, Canadian, and Mexican upstream (i.e., production), downstream (i.e., refining) oil activity, and end-user demand.
If you’re already subscribed and/or appreciate the free chart and summary, hitting the LIKE button is one of the best ways to support my ongoing research.
North American total liquids production narrowly reset an all-time high of 28.75 MMbbl in August as fresh all-time high US output, driven by a new post-pandemic crude output record, offset a pullback in Canadian output. Year-to-date continental liquids output was 1.85 MMbpd higher y/y, pulling year-to-date annual average growth to 1.7 MMbpd.
North American refined product output rose 181 kbpd m/m to 23.2 MMbpd, the highest level since the summer of 2019 prior to the wave of pandemic-induced refinery closures.
Continental demand roared higher on the back of a surge in US distillates consumption, rising 832 kbpd m/m to 25.7 MMbpd, a fresh pandemic-era high and the highest level since August 2019; annual demand growth has averaged nearly 200 kbpd year-to-date.
Note: important detailed comments below regarding 1) the EIA’s crude supply adjustment and tight oil decomposition data, and 2) the ongoing process of re-adding previously omitted official Suncor production data to Canadian oil sands balances.


