North American Oil Data Deck (November ‘22)
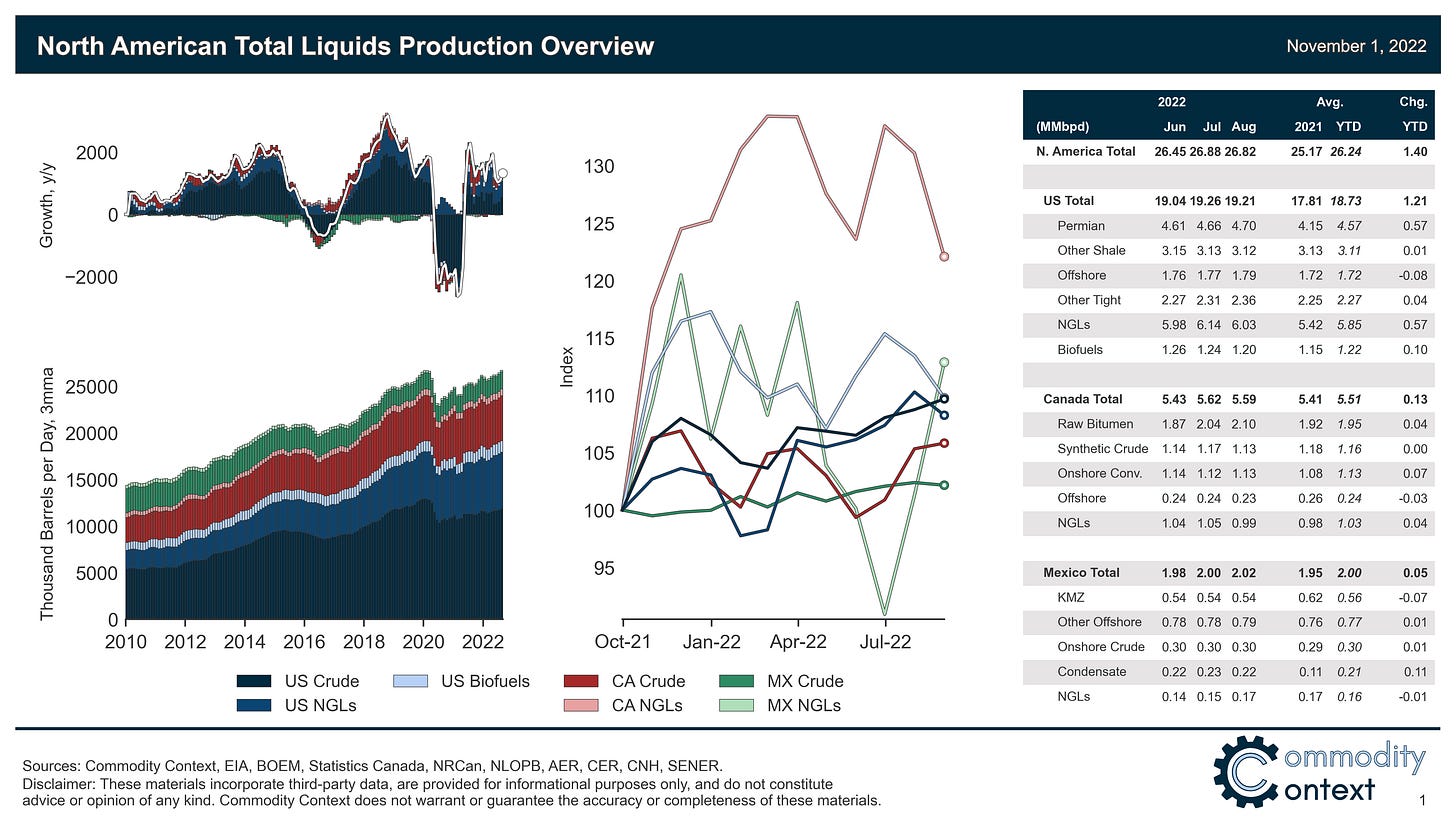
Continental liquids output fell back in August on NGL losses despite crude oil gains; US output in July revised higher to fresh all-time high, outstripping the pre-pandemic peak.
This 24-page November 2022 edition of my monthly data-dense and visualization-heavy North American Oil Data Deck (attached PDF below paywall) is exclusive to paid Commodity Context subscribers.
The deck contains detailed, decomposed accounting for Canadian, US, and Mexican upstream oil activity (i.e., the production side); I plan to add trade flow analysis to future editions, followed by refinery activity and domestic demand over the coming months.
If you’re already subscribed and/or appreciate the free chart and summary, hitting the LIKE button is one of the best ways to support my ongoing research.
North American total liquids production fell back by 64 kbpd m/m in August (+1,396 YTD y/y) from the all-time high reached in July.
Crude and equivalent production rose by 121 kbpd m/m but was overwhelmed by larger losses in both NGLs (-145 m/m) and other liquids (-40 m/m); this is the first month since June 2021 in which continental crude production rose while NGL output fell.
The latest EIA update saw an upward revision to US crude production in July, which lifted July to a fresh all-time high for US liquids output of 19,258, outstripping the prior record of 19,237 reached just before the pandemic battered the industry in January 2020.


