
North American Oil Data Deck (May 2026)
Continental production jumped back to life in February from winter storm-depressed January levels while stateside product demand surged to the strongest February level on record.

This 47-page May 2026 edition of my monthly data-dense, visualization-heavy North American Oil Data Deck is exclusive to paid Commodity Context subscribers (attached PDF below paywall). The deck contains detailed and decomposed accounting for US, Canadian, and Mexican upstream (i.e., production) and downstream (i.e., refining) oil activity as well as end-user demand.
This report includes some additional charts and analysis above the paywall outlining recent trends in US weekly data, with a particular focus on the geographic spread of US crude inventories and the marked shift in trade flows.
If you’re already subscribed and/or appreciate the free chart and summary, hitting the LIKE button is one of the best ways to support my ongoing research.

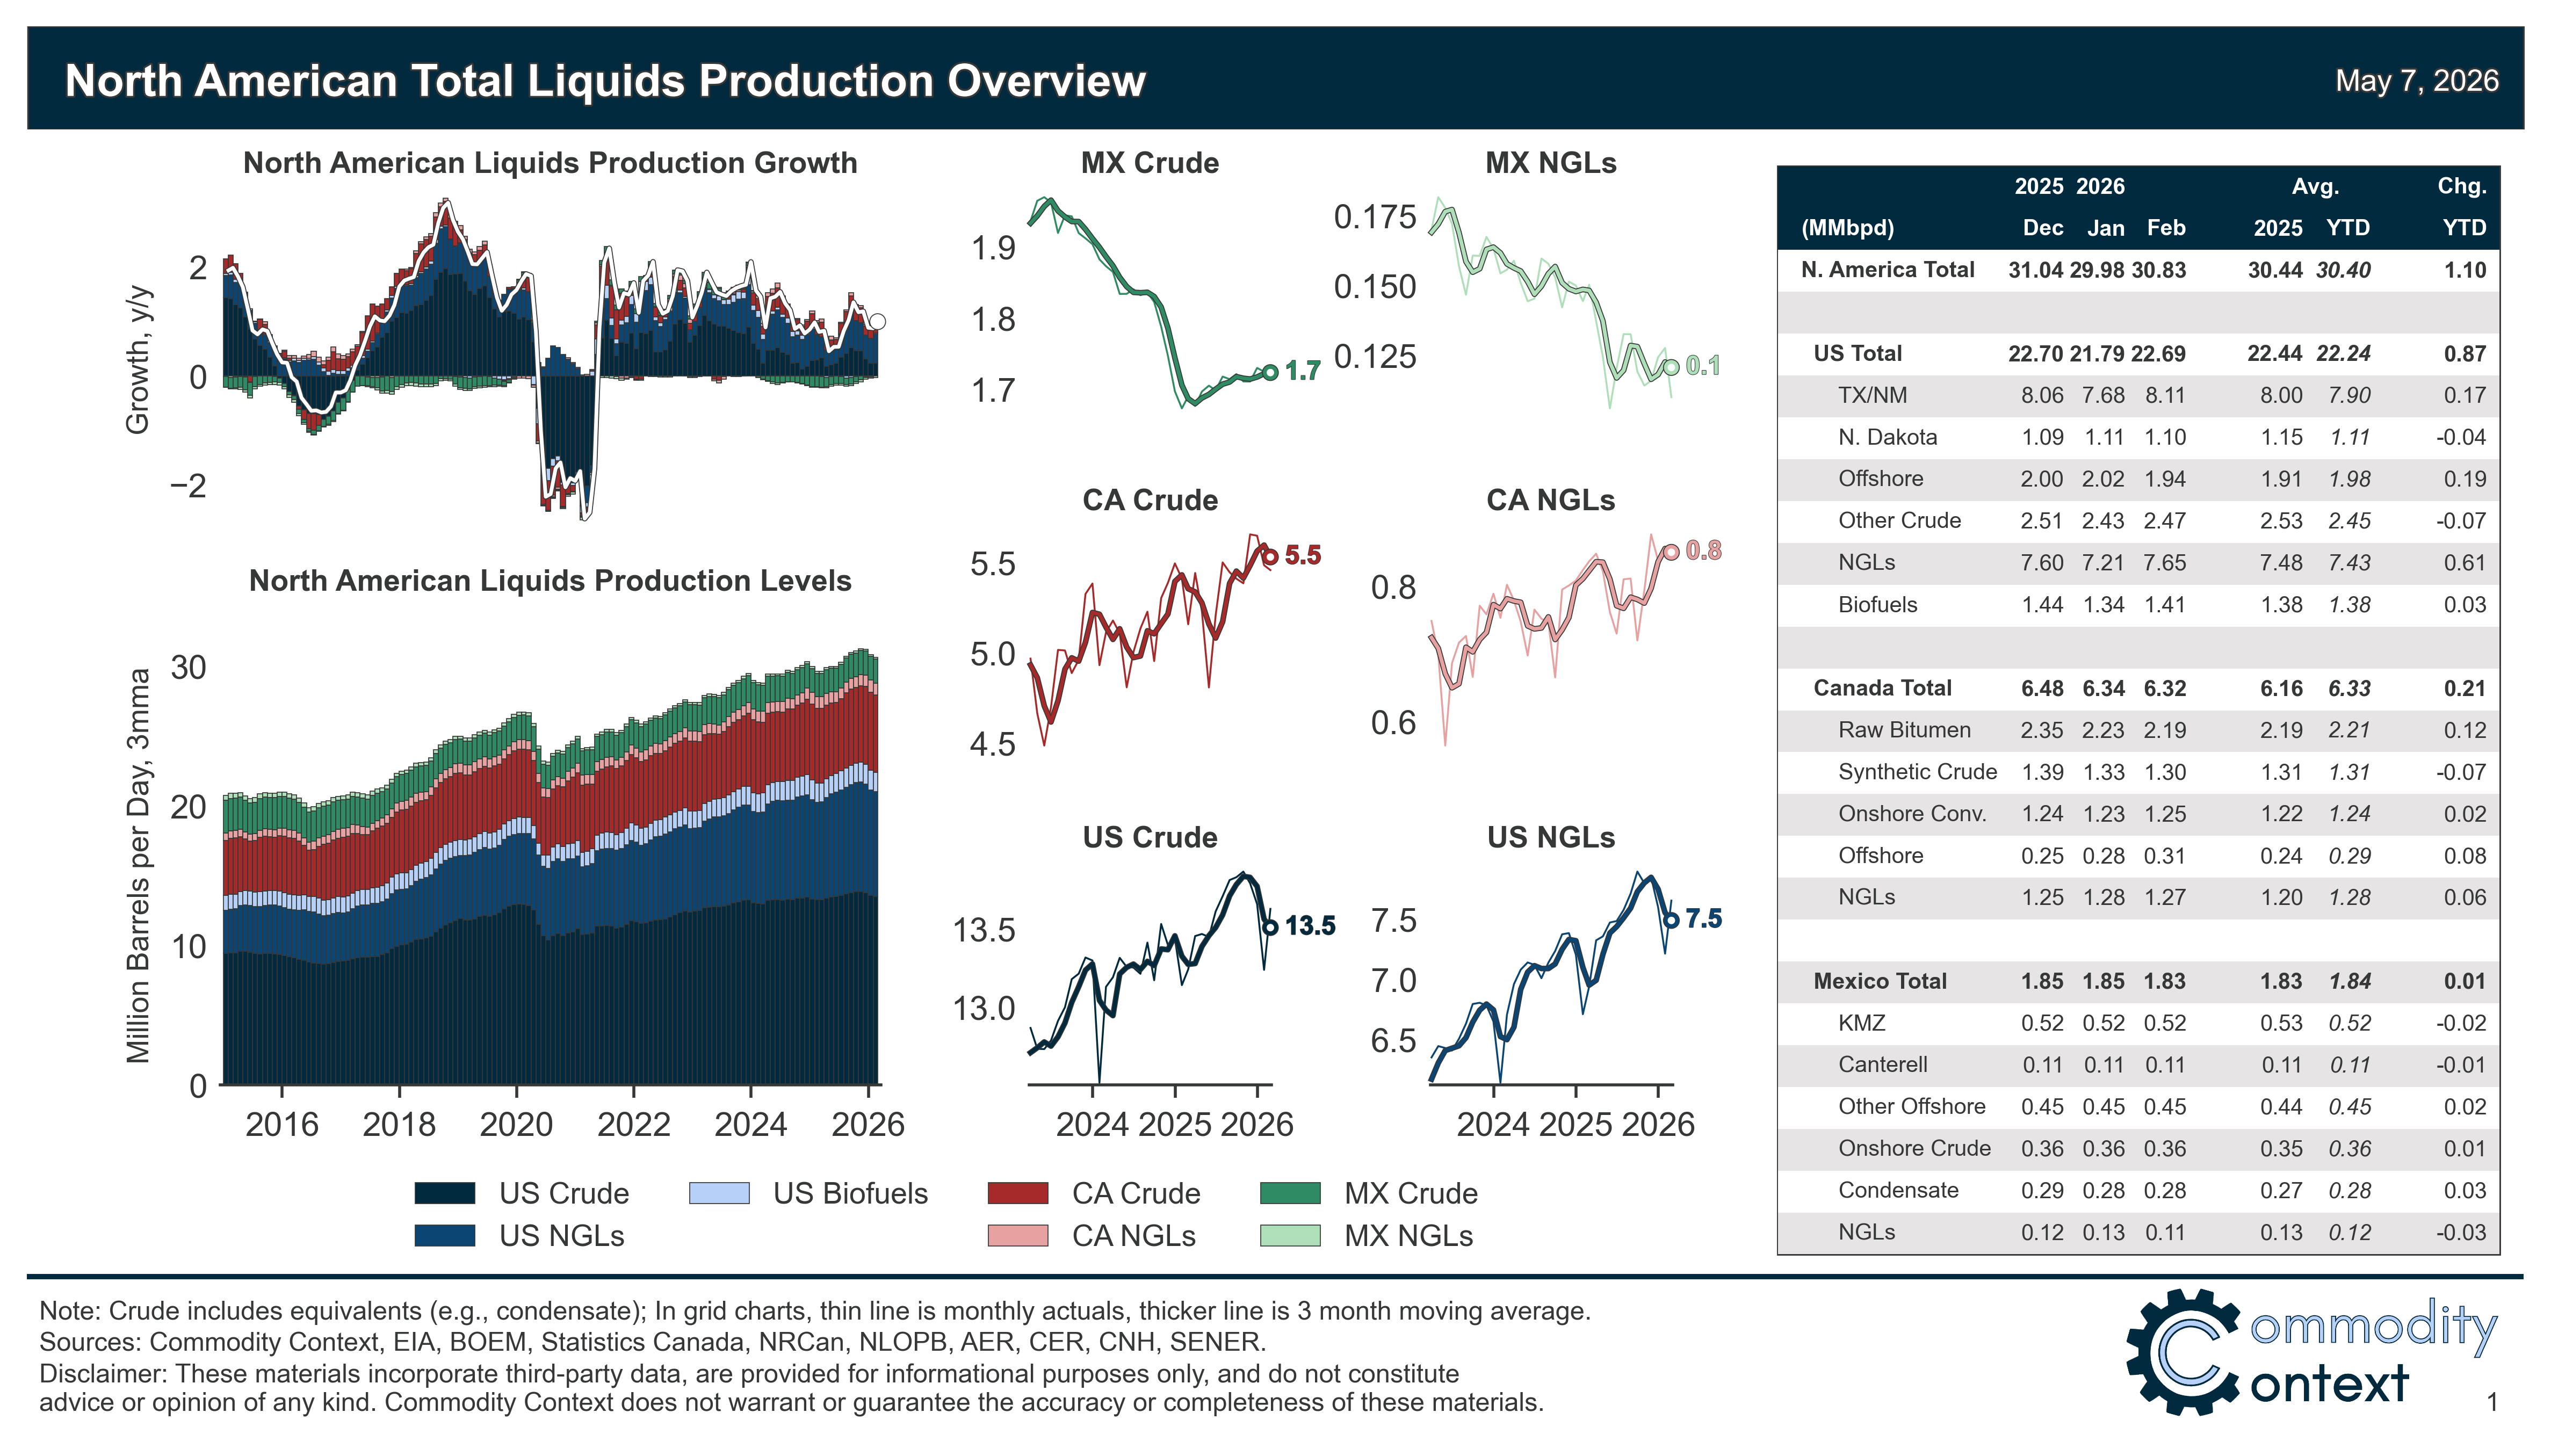
North American petroleum liquids production surged back to life following the sizable shut-ins forced by Winter Storm Fern in January, rising +0.9 MMbpd m/m (+1.5 MMbpd y/y) in February to 30.8 MMbpd.
Continental demand was shockingly strong in February at 25.8 MMbpd (+0.5 MMbpd m/m, +1.0 MMbpd y/y) driven by US growth, especially growth in US diesel consumption.
In addition to our regular monthly tracking, this month includes some context around the data published by the US Energy Information Administration (EIA) in its Weekly Petroleum Status Report (WPSR). Higher-frequency data is particularly important as the market attempts to handicap rapidly evolving fundamentals.
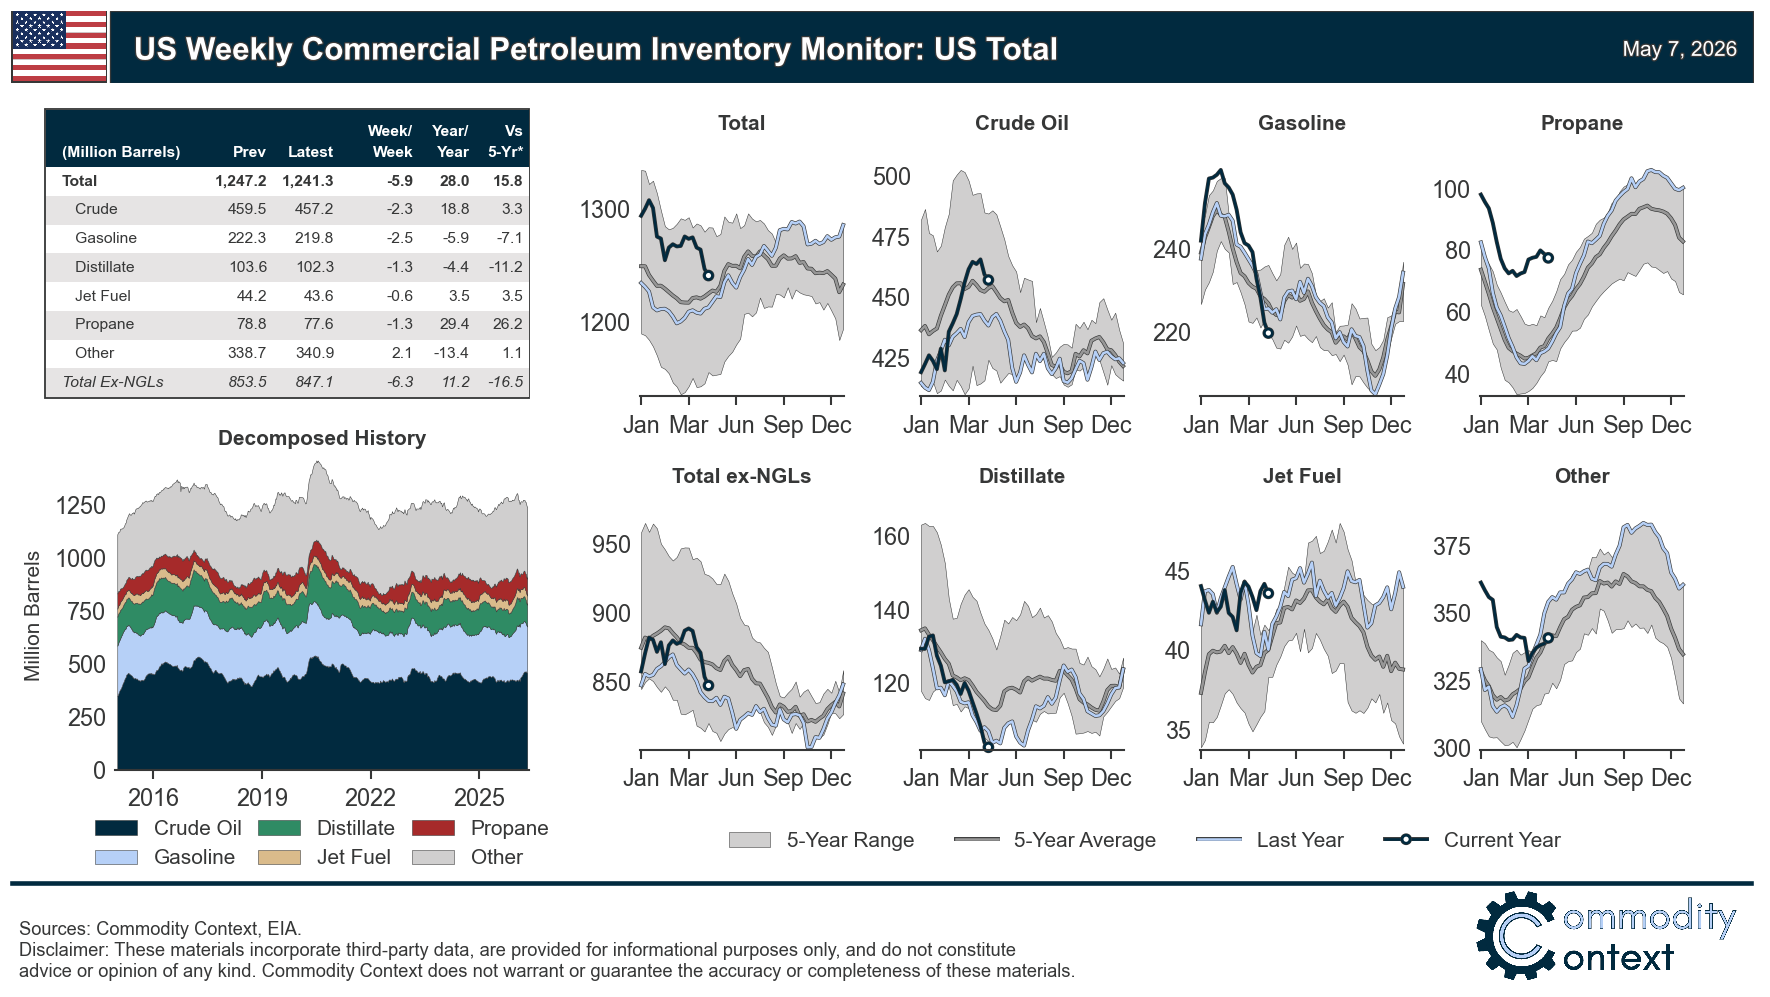
The latest weekly US inventory data continued the prior week’s steep draws but at roughly half the pace; total US petroleum stocks fell -11.1 MMbbl w/w—between commercial stocks (-5.9 MMbbl) and the SPR (-5.2 MMbbl)—compared to a more than -24 MMbbl draw the prior week.
US gasoline stocks are at the very bottom of their trailing 5-year seasonal range while diesel stocks are setting fresh 5-year lows, falling below even last year’s depressed levels.
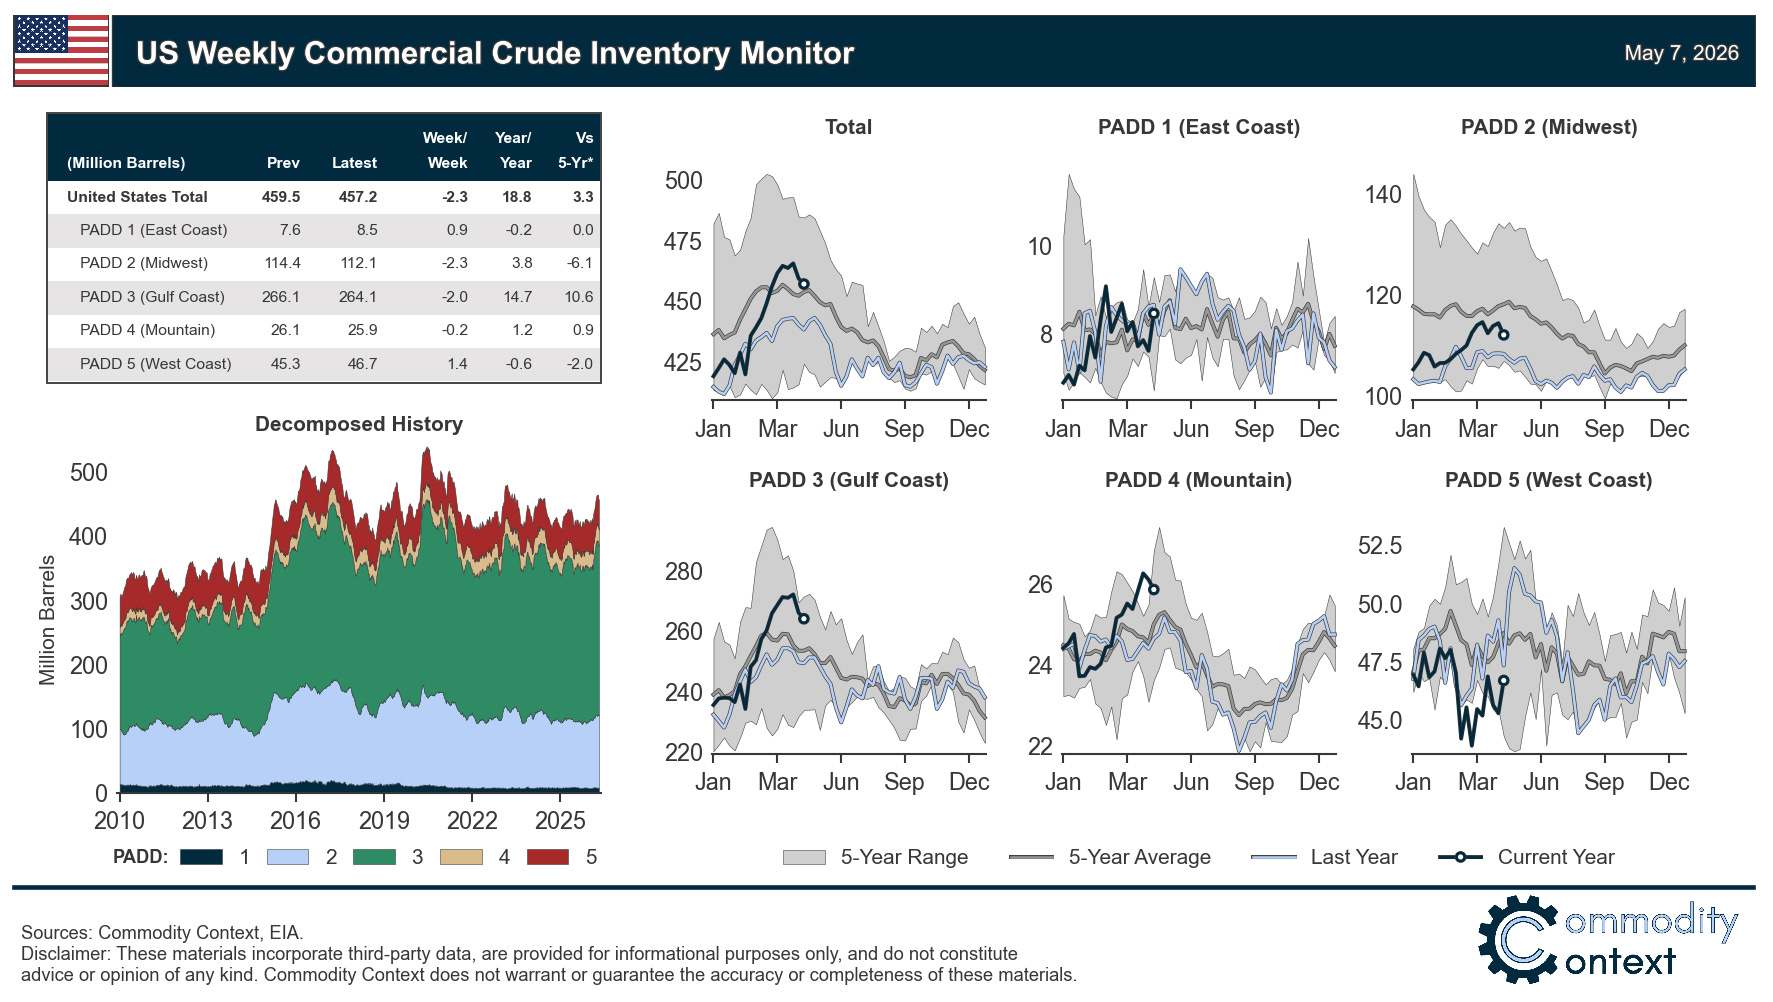
Only crude inventories are holding in there at still-elevated levels, with the bulk of those stocks held in the US Gulf Coast (USGC aka PADD3). Elevated inventory levels may have been, in part, reflecting precautionary demand as refiners hoarded barrels, which is behaviour—i.e., building inventories despite steep backwardation to hedge physical availability—that we saw in Europe in 2022. However, the bulk is, likely, best understood as export-staging stocks, which will be rapidly drawn down given that an armada of tankers continues to flock to the USGC to supply a Hormuz-starved global market.
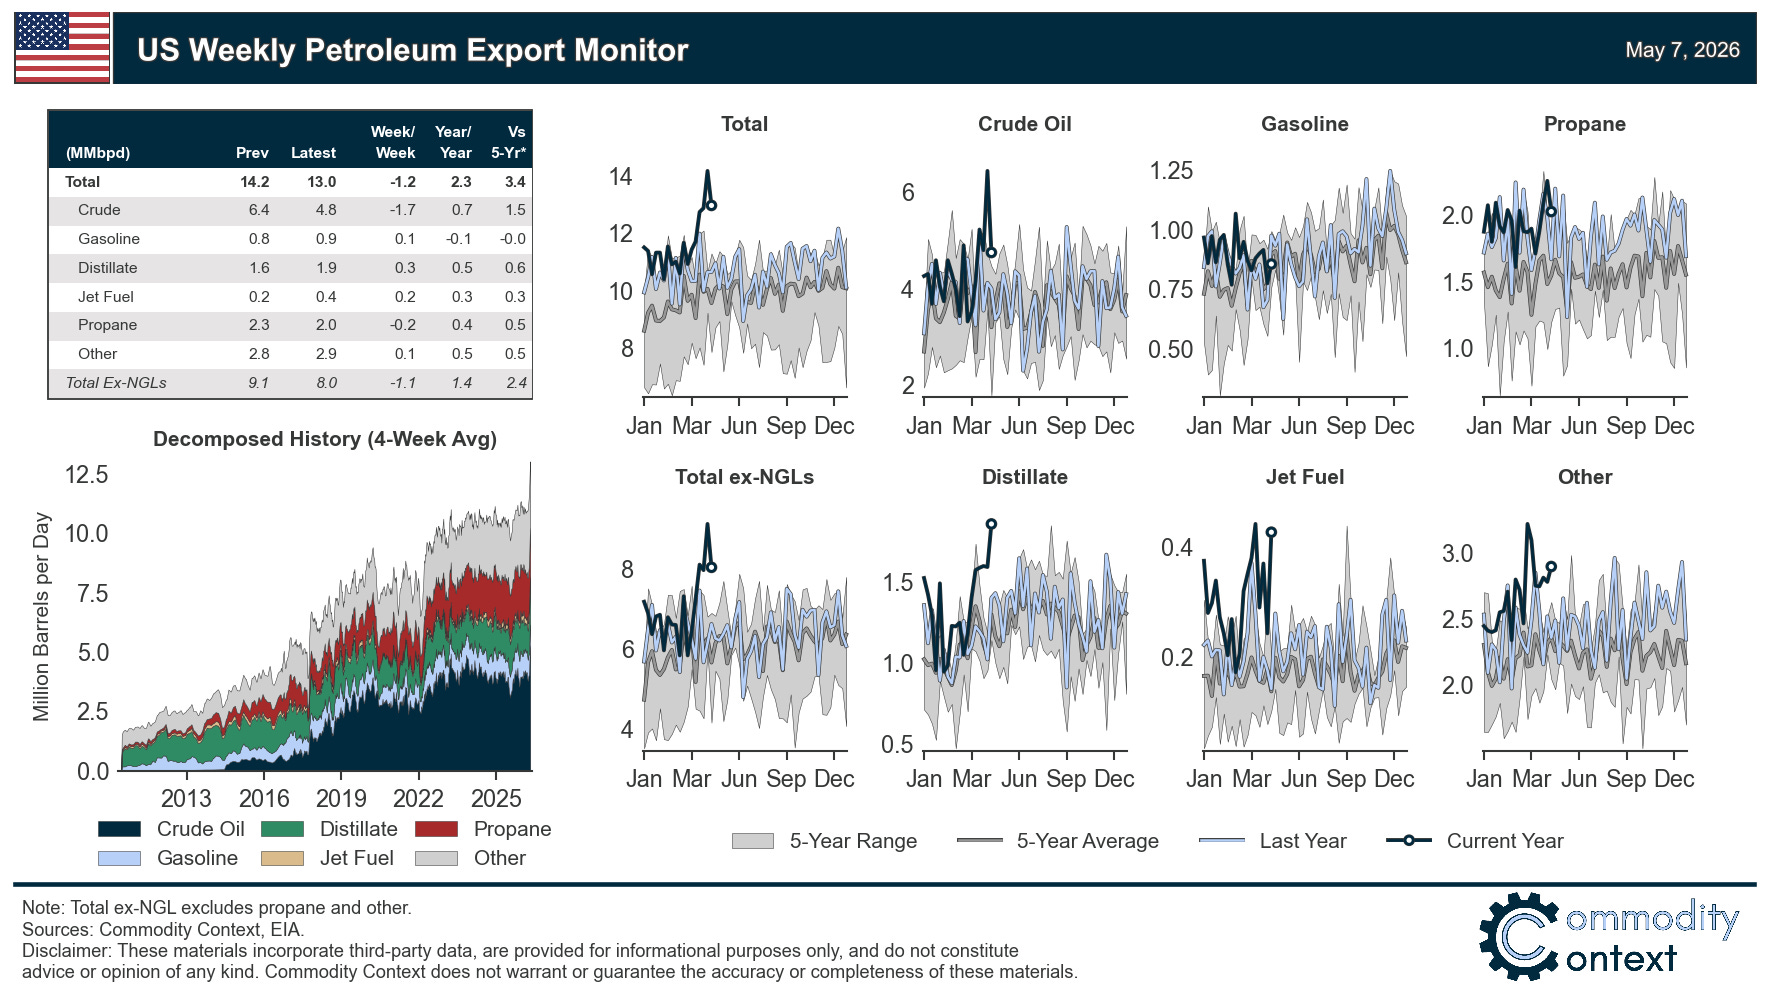
Two weeks ago, US total petroleum exports hit an all-time high of 14.2 MMbpd according to weekly EIA data—up from a pre-war January-February average of 11.1 MMbpd. Last week, those exports pulled back notably from that high-water mark; but, at 13.0 MMbpd, still represent a near-record, second only to the prior week’s high. At the same time, the pullback in headline exports was driven by crude oil while American exporters set a fresh all-time high export record for refined products, specifically, which rose +0.5 MMbpd w/w to 8.2 MMbpd.
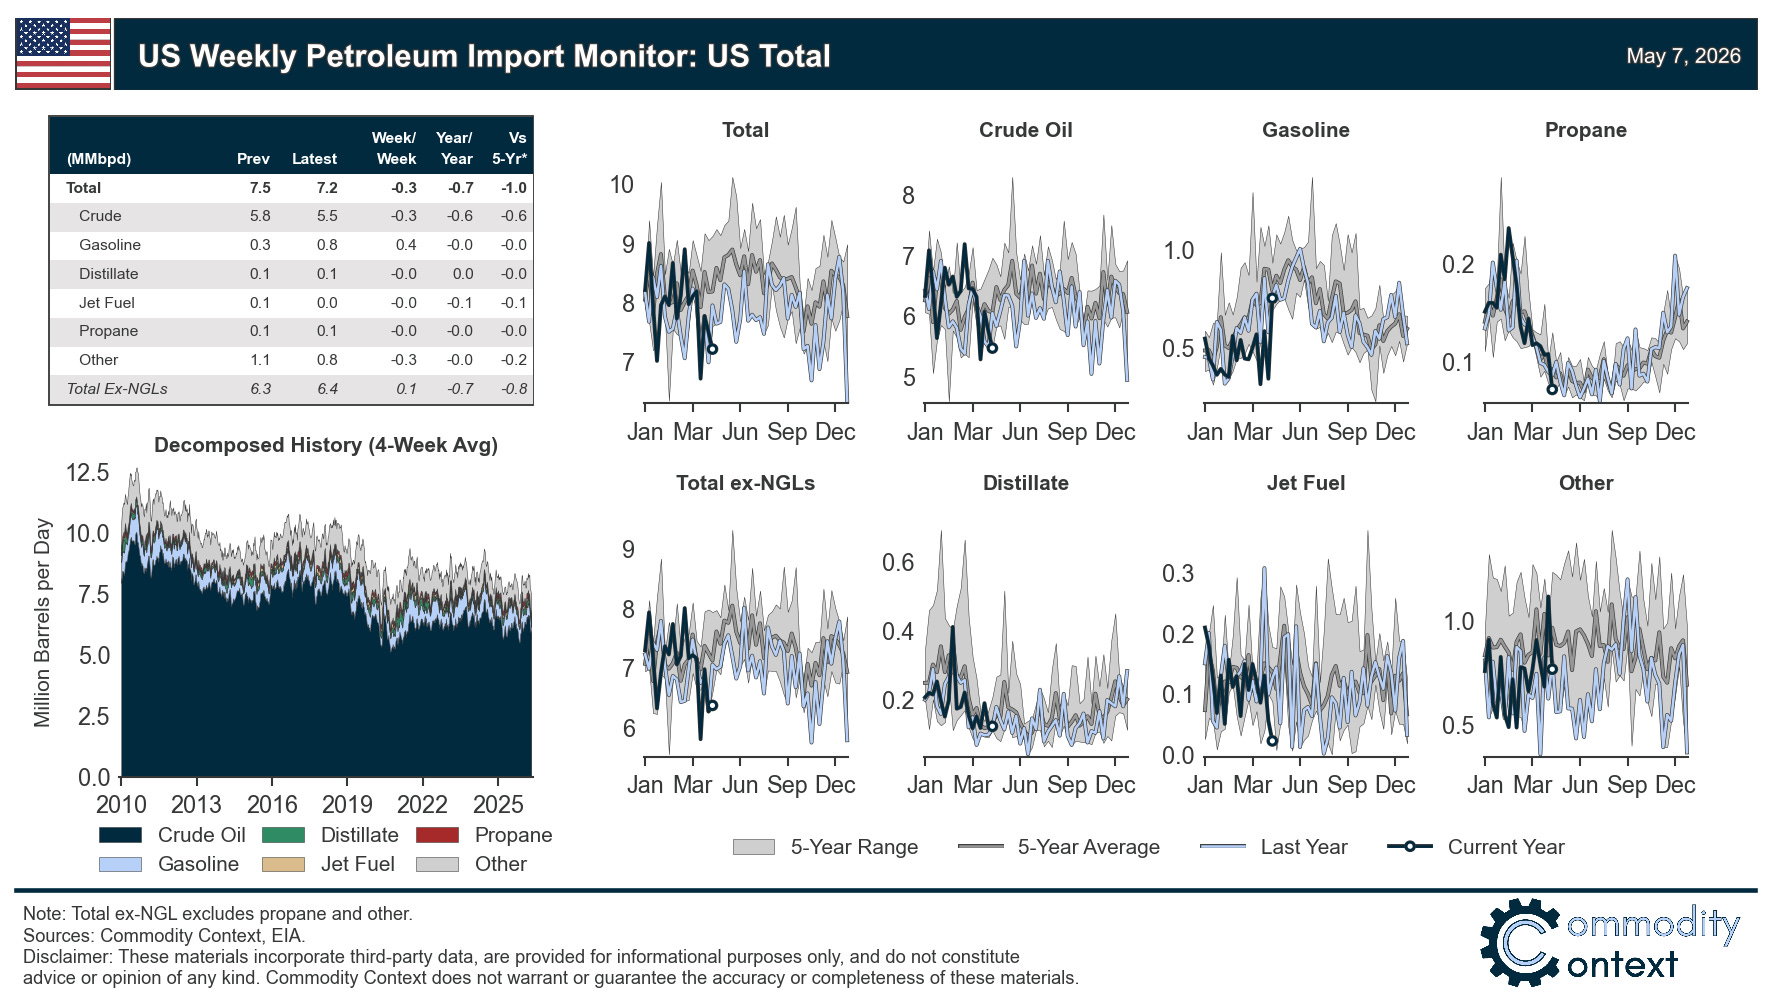
Finally, while exports are running hot, imports are running weak. Crude imports set fresh 5-year seasonal lows while gasoline, which was running exceptionally low over recent weeks, finally popped higher as the US East Coast attempts to accumulate supplies ahead of the upturn in summer driving demand.
[Full PDF Deck and Country-Level Analysis Below Paywall]