
North American Oil Data Deck (March 2026)
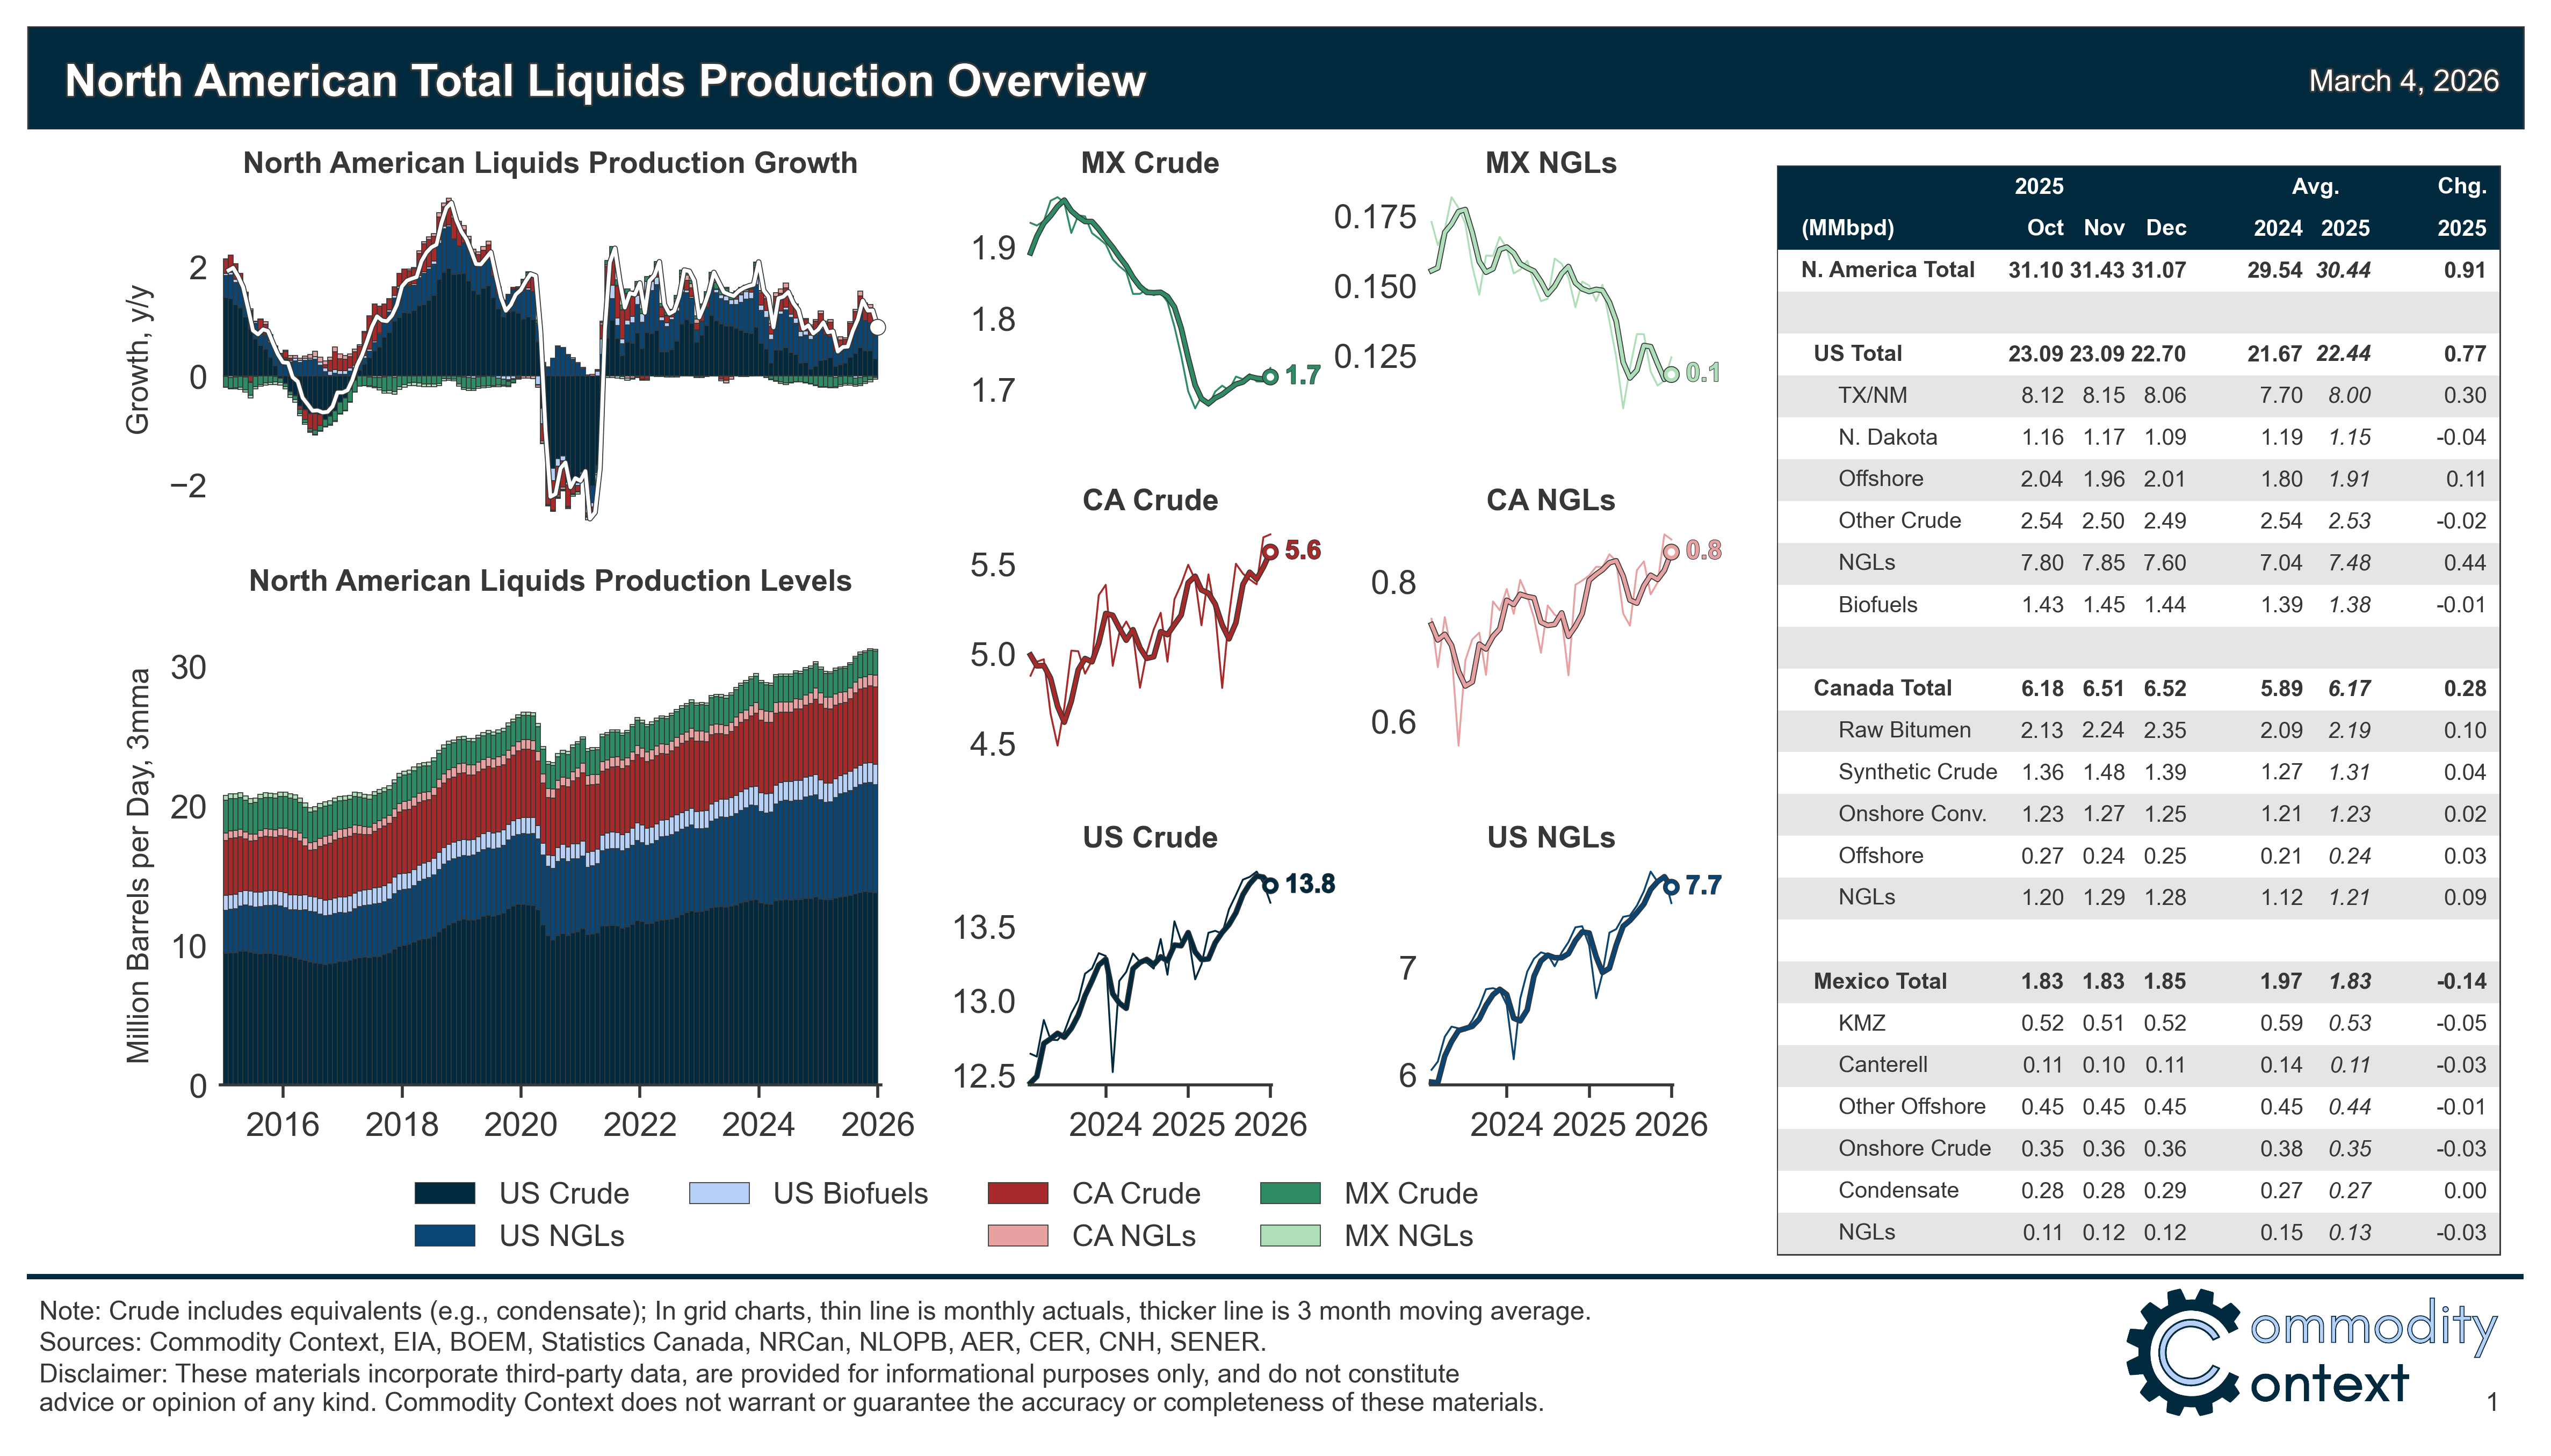
Continental petroleum output slipped in December, driven by the US’ second consecutive monthly crude production decline and softened by firmer activity in Canada and Mexico.

We will return to the ongoing crisis in Iran shortly after a very quick break for a monthly data update.
This 47-page March 2026 edition of my monthly data-dense, visualization-heavy North American Oil Data Deck is exclusive to paid Commodity Context subscribers (attached PDF below paywall). The deck contains detailed and decomposed accounting for US, Canadian, and Mexican upstream (i.e., production) and downstream (i.e., refining) oil activity as well as end-user demand.
If you’re already subscribed and/or appreciate the free chart and summary, hitting the LIKE button is one of the best ways to support my ongoing research.

North American petroleum liquids output slipped -353 kbpd m/m from November’s all-time high to 31, 075 kbpd in December, the lowest level since August, with year-over-year gains slowing to +824 kbpd; monthly declines were driven by the US, which was crude output slip for the second consecutive month, while Canada held steady and Mexico actually notched the first month of y/y growth since 2023.
Continental refined product demand rose a hefty +474 kbpd to 25,551 kbpd in December, up +429 kbpd y/y with growth driven primarily by the US and Mexico, while Canada slid on the month.
[Full PDF Deck and Country-Level Analysis Below Paywall]