
North American Oil Data Deck (June 2026)
Production growth stabilizes in the US and slows in Canada; US refinery yields shifted sharply in favour of globally-scarce jet fuel but at the expense of gasoline.

This 47-page June 2026 edition of my monthly data-dense, visualization-heavy North American Oil Data Deck is exclusive to paid Commodity Context subscribers (attached PDF below paywall). The deck contains detailed and decomposed accounting for US, Canadian, and Mexican upstream (i.e., production) and downstream (i.e., refining) oil activity as well as end-user demand.
If you’re already subscribed and/or appreciate the free chart and summary, hitting the LIKE button is one of the best ways to support my ongoing research.

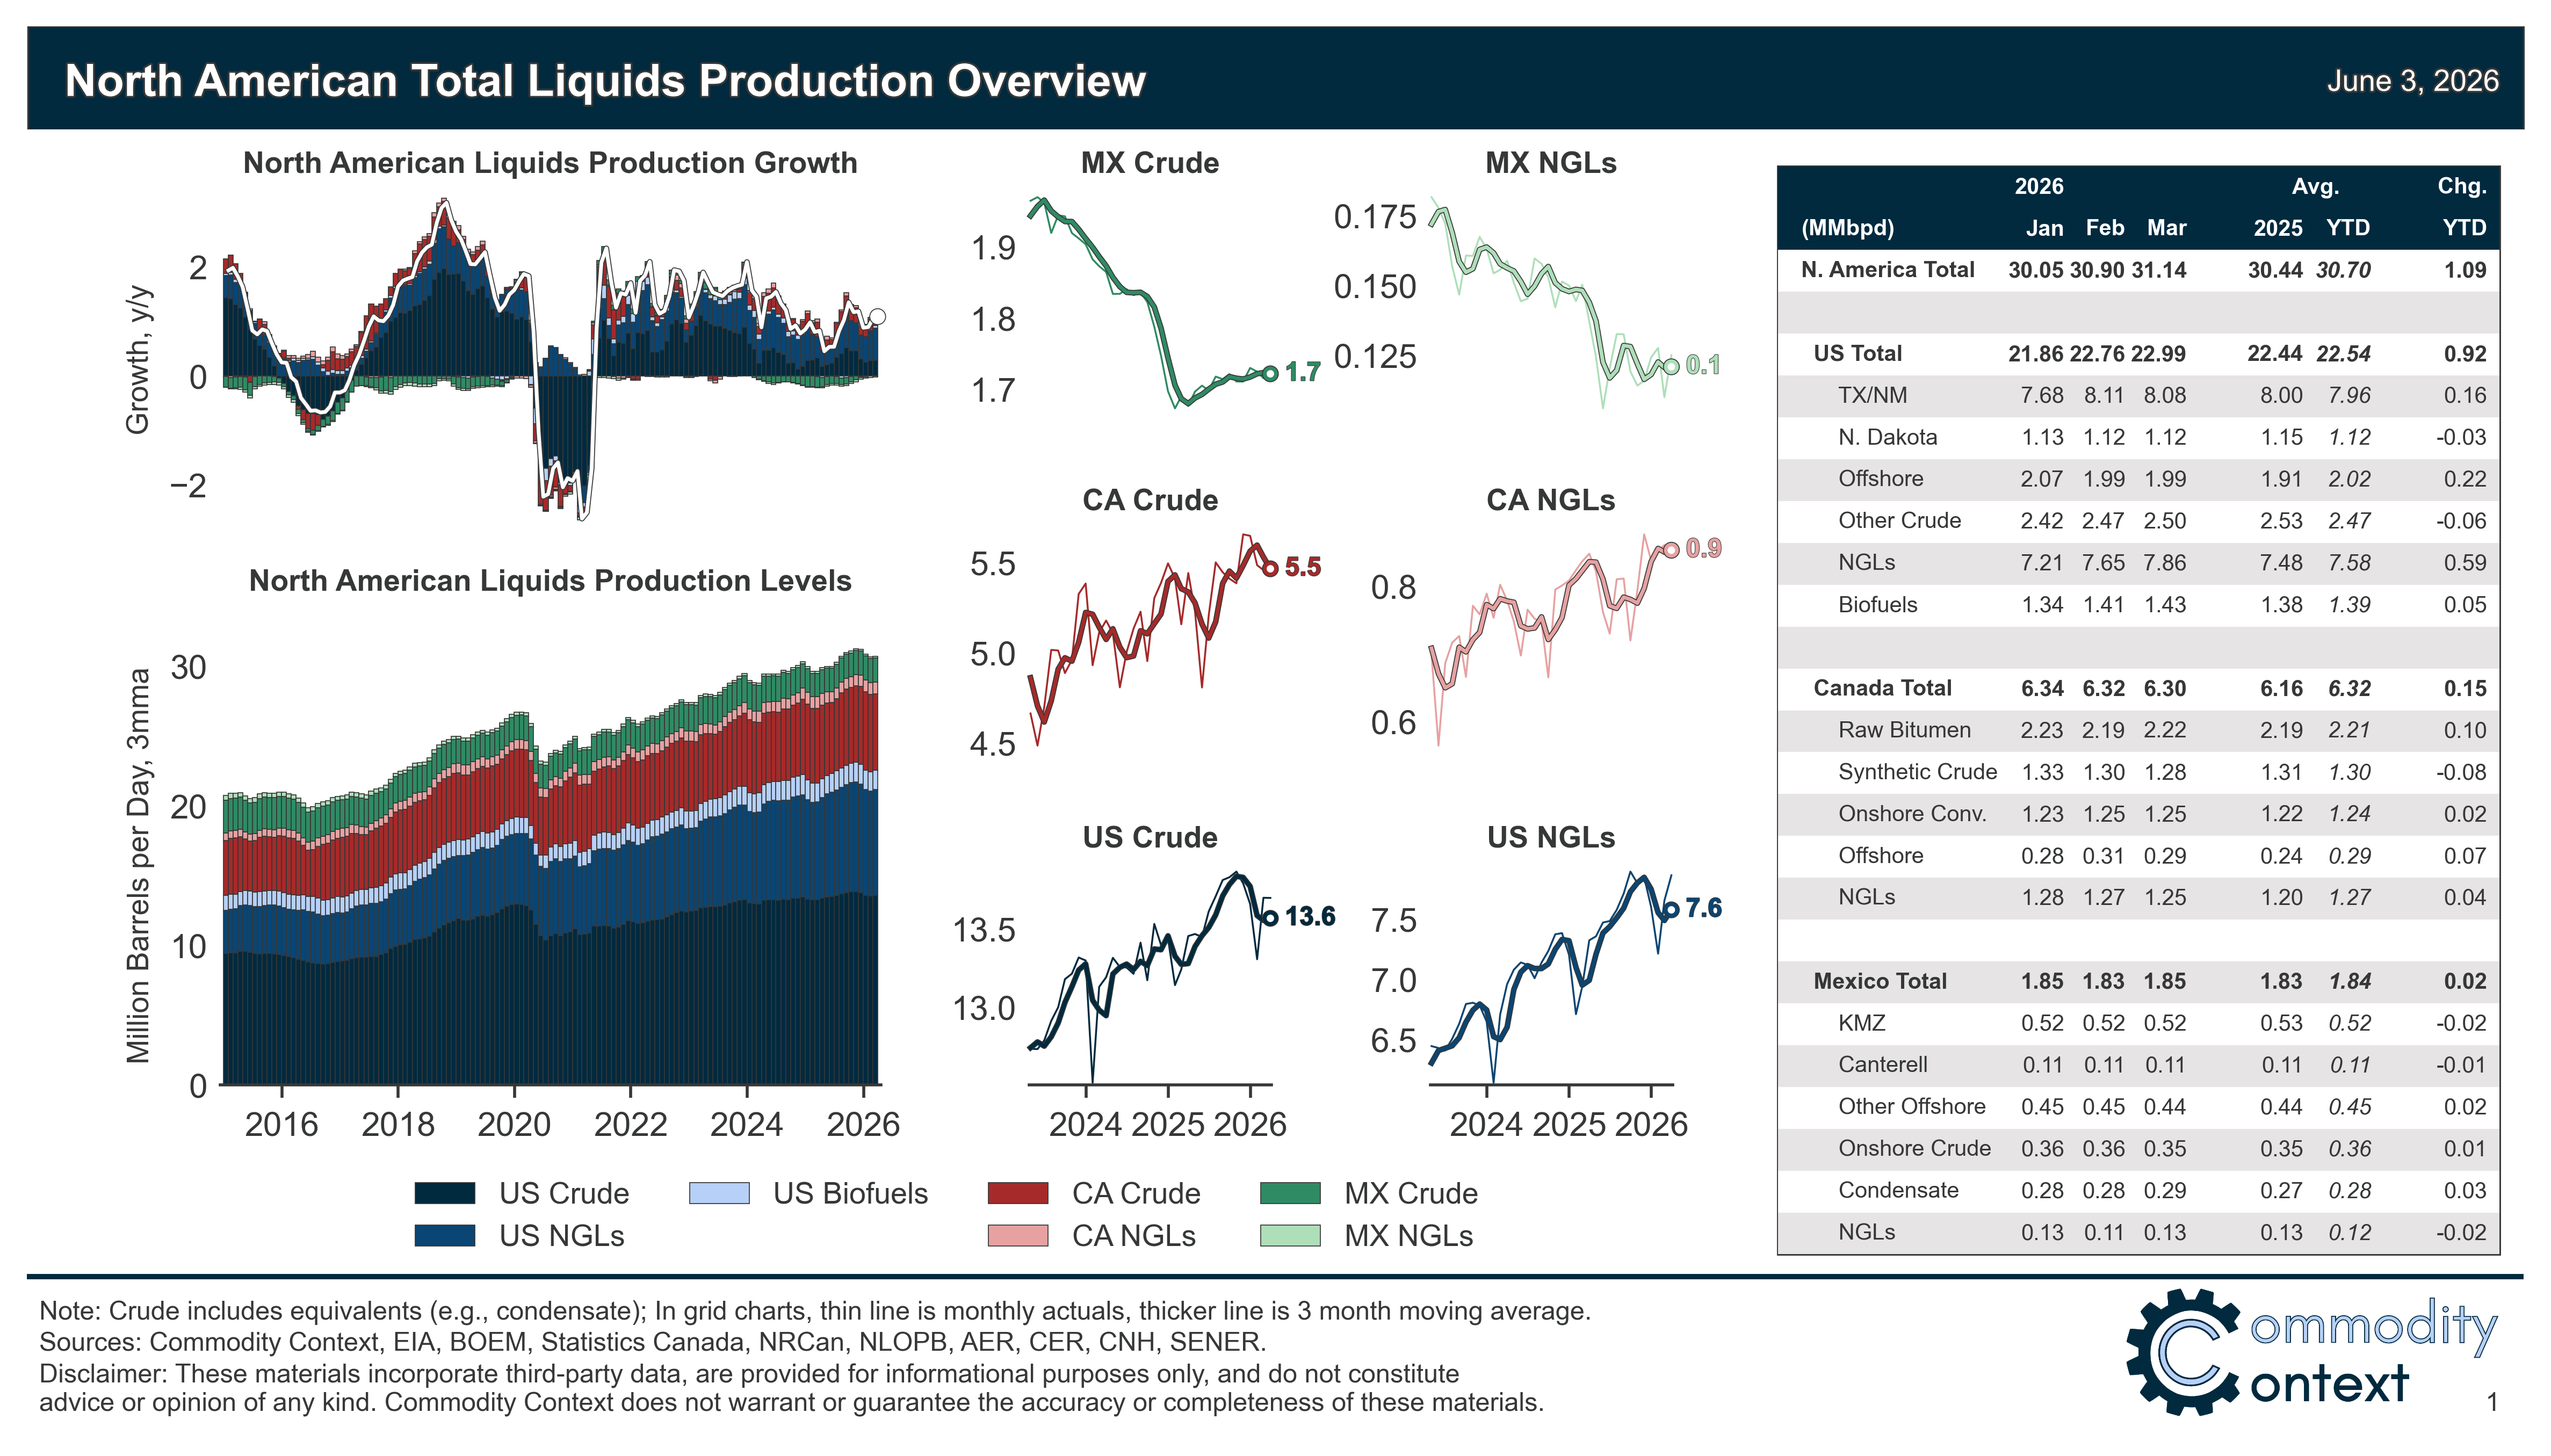
North American petroleum liquids production advanced +239 kbpd m/m to 31,141 kbpd in March (+924 kbpd y/y) driven almost entirely by the US; Canadian growth took a temporary breather while Mexico improved from a heavy drag on continental output to a modest boost.
Continental petroleum product demand fell -803 kbpd m/m to 25,019 kbpd in March (+555 kbpd y/y), with the US propelling the bulk of that growth thanks to heavy increases in NGL demand. US refinery output also saw a stark shift in yields away from gasoline toward globally scarce jet fuel amidst exploding margins, helping stave off jet fuel shortages at the cost of tighter gasoline markets.
[Full PDF Deck and Country-Level Analysis Below Paywall]