

This 47-page July 2026 edition of my monthly data-dense, visualization-heavy North American Oil Data Deck is exclusive to paid Commodity Context subscribers (attached PDF below paywall). The deck contains detailed and decomposed accounting for US, Canadian, and Mexican upstream (i.e., production) and downstream (i.e., refining) oil activity as well as end-user demand.
If you’re already subscribed and/or appreciate the free chart and summary, hitting the LIKE button is one of the best ways to support my ongoing research.

North American petroleum liquids production advanced +188 kbpd m/m to 31,350 kbpd in April (+1,354 kbpd y/y) on the back of a reacceleration of output growth in both Canada and the US; what was expected to be the beginning of the US shale patch’s price-driven contraction was delayed by the scorching Iran War rally, which allowed many producers to hedge forward and de-risk further volume growth.
Continental petroleum product demand rose +177 kbpd m/m to 25,165 kbpd in April (+491 kbpd y/y) as slowing Canadian consumption was offset by booming demand in the United States and modest growth in Mexico.
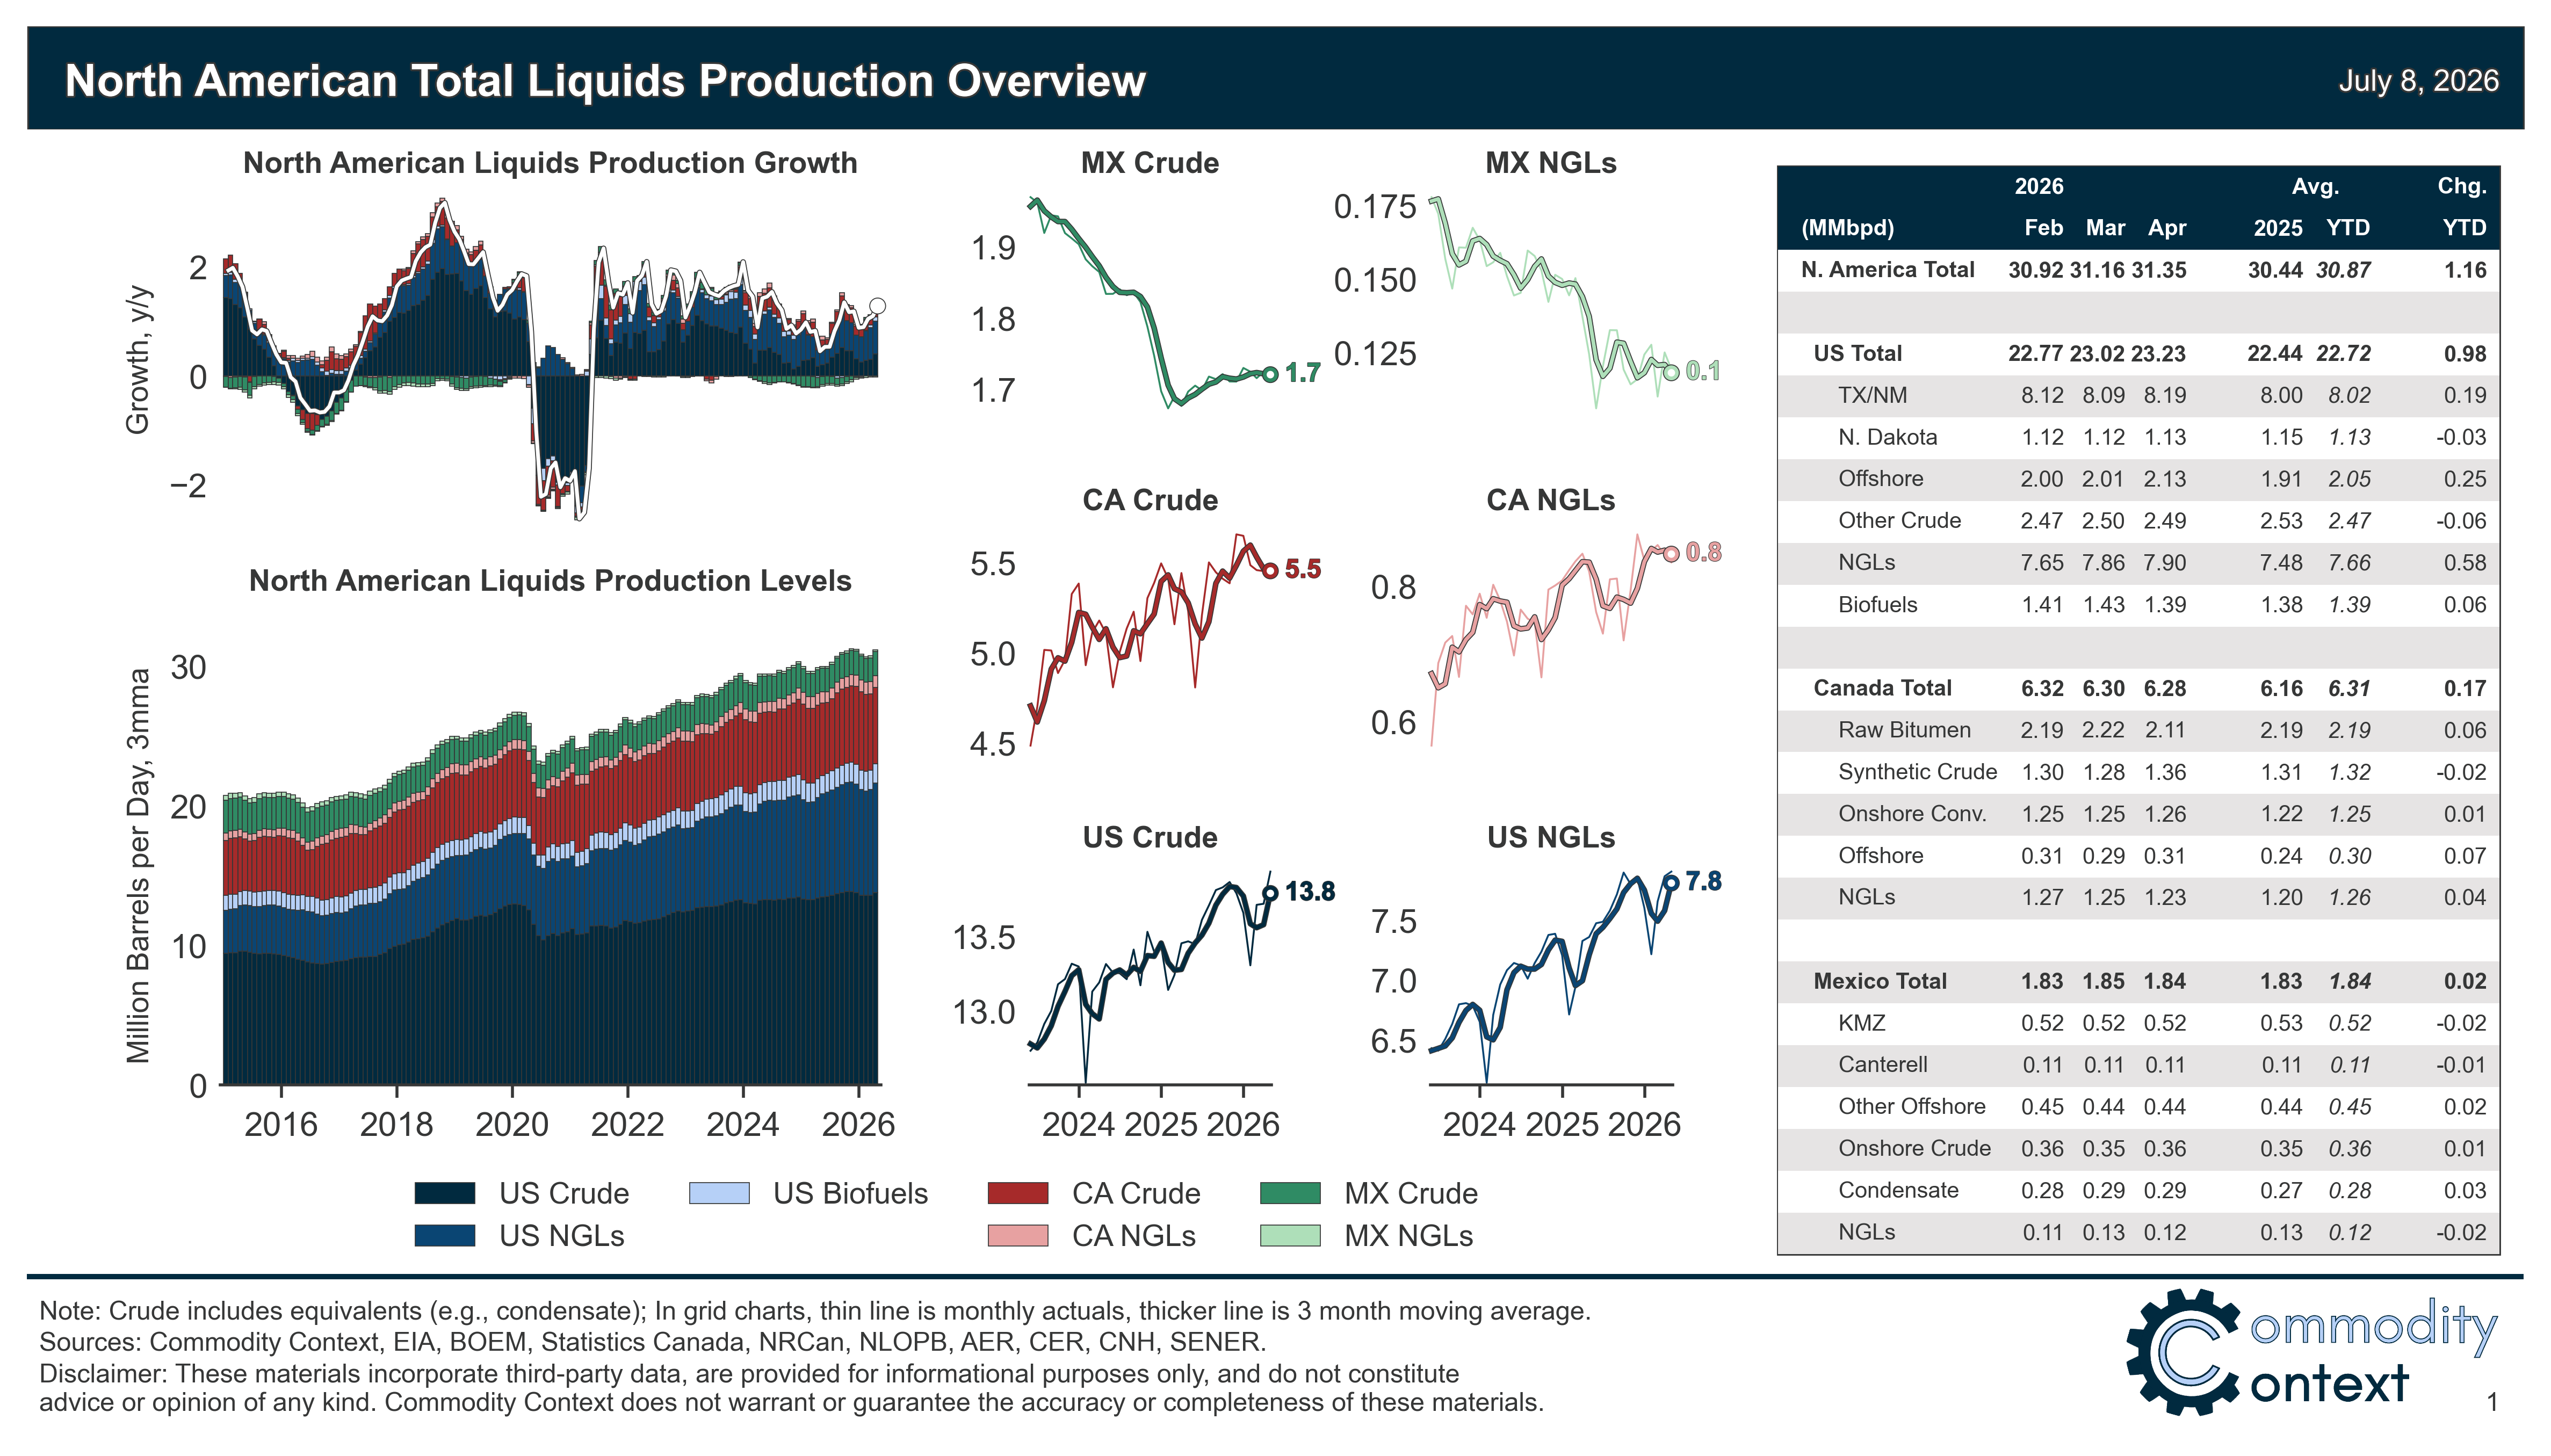
[Full PDF Deck and Country-Level Analysis Below Paywall]